Is it your job to make sure that more people learn about your company and interact more with your profile? Then you have to find out what your target audience finds exciting and what not and when they are online.
In this guide, you’ll learn about the features of Fanpage Karma that will help you evaluate your own posts as well as those of your competitors so that you can improve your content and generate more awareness.
(Click to enlarge the screenshots.)
1. Post Graph
The post graph reflects how well posts have performed with respect to a selected metric. It displays all posts of the period as points above the time axis. The higher a point is, the higher the value.
The more interactions a post receives, the more relevant it is rated by the algorithm of the respective network. The more relevant a post is, the more reach it receives. Not all interactions are worth the same amount. On Facebook, shares weigh more heavily than comments and comments weigh more heavily than likes. On Instagram, saves weigh more than comments and comments weigh more than likes.
An important first step is to evaluate which posts in your industry have received the most valuable interactions.
Here’s how it works
- Open a dashboard with the profiles of your industry (if you haven’t created a dashboard yet, check out these instructions)
- Go to the “Analysis” section
- Select a key figure in the post graph using the drop-down menu, we recommend Post Interaction or the Total Number of Reactions
- Click on the posts that are highest one by one to display them in the area to the right
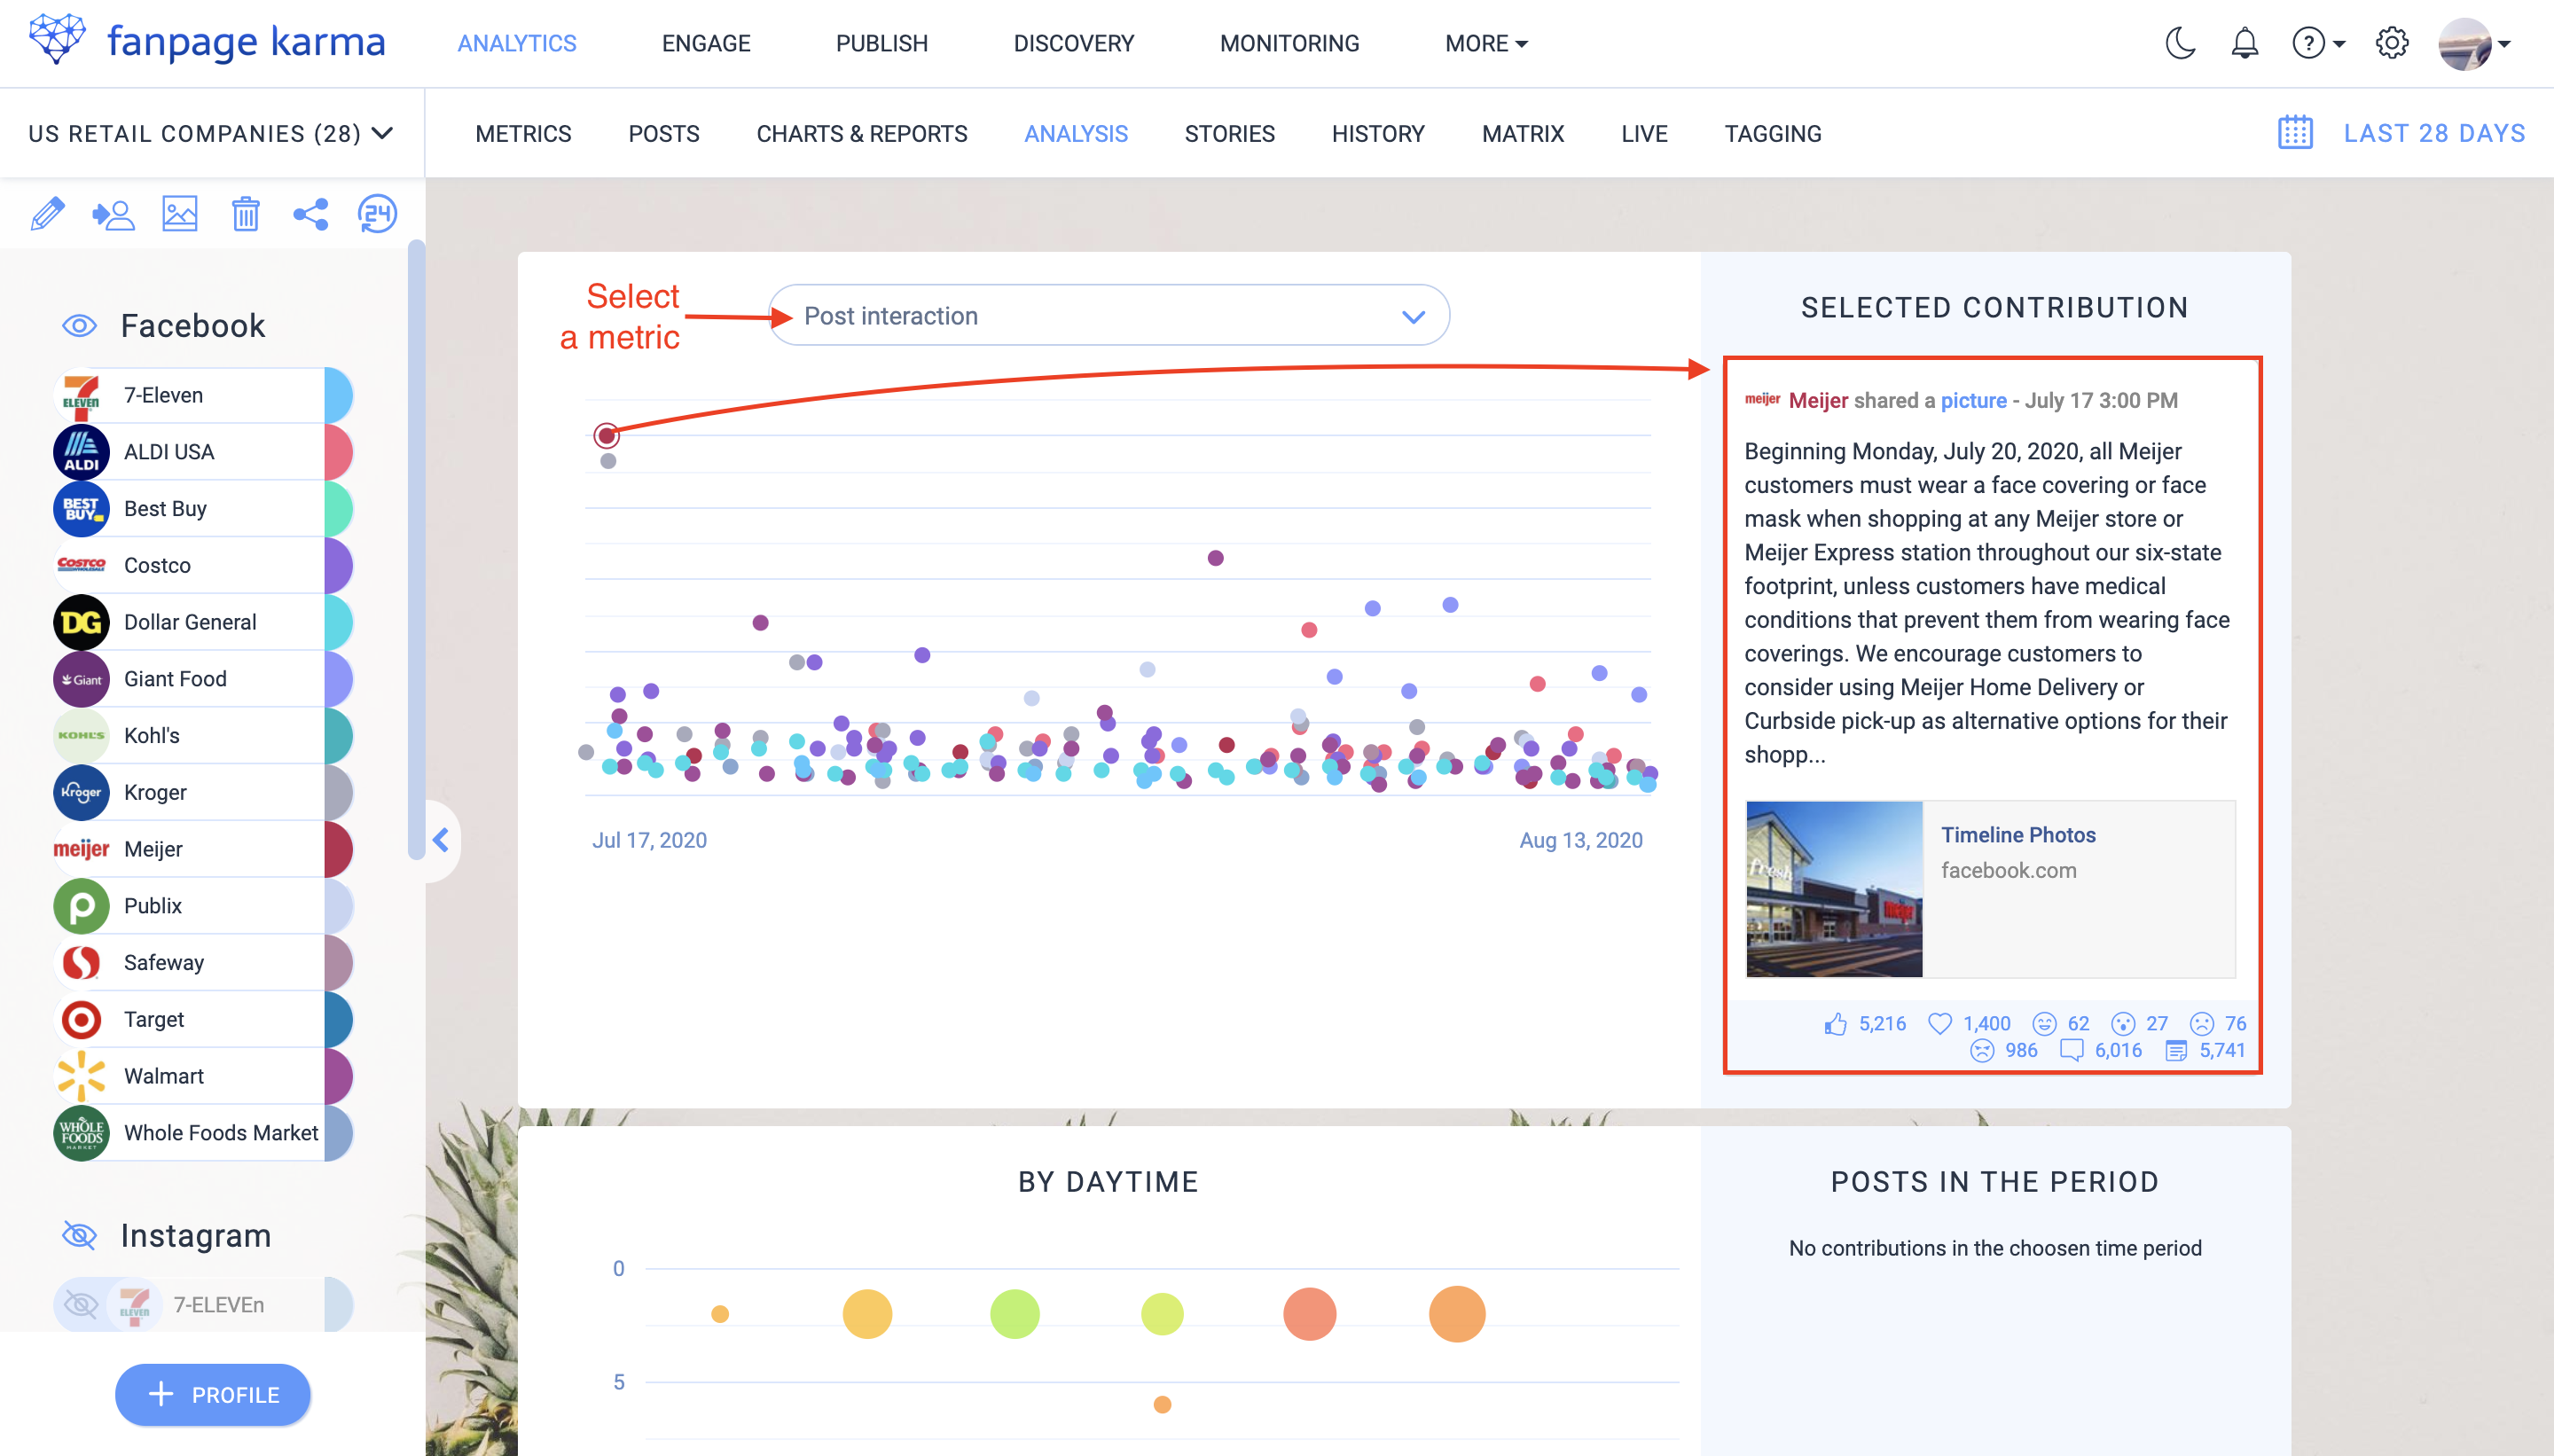
The example shows the post graph of the American retail industry on Facebook. One of the most successful posts is from Meijer, in which the company explains that from now on masks are mandatory in all branches. The users support this decision so much that it received a post interaction of 1.3 %.
Tip: If you want to find the post that was the best overall, choose the total number of reactions. However, if you compare profiles of different sizes, this figure is of little use to you, since the profile with the most followers always gets the most interaction in absolute terms. In such a case, post interaction is the best measure, as it relates the number of interactions received to the number of followers. This means that the size of the profiles is no longer a factor and you can compare the relative values.
After you have examined the most successful posts in the graph, it’s worth taking a look at the weakest posts as well. They show you which content is less rewarding. When you’re done with this, you’ll have a pretty good idea of what kind of posts are most appealing to your target audience.
2. Top Content
A little further down in the analysis section you will find rankings of the most interactive posts of the profiles. A variety of top texts, images, videos, carousels, links and hashtags are displayed.
The gallery shows the top content of the American retail industry. You can see how many interactions a post has received by looking at the top right of the post. In the example it is noticeable that pictures are far more successful on average than video posts. A result you would not expect.


Tip: Click on a post in the list to view it in full size on the network.
The graphics “Most frequently used words” and “Most frequently used hashtags” show you which topics are better and which are not so well received by your target audience. The more frequently keywords are used, the larger they are displayed, and the more interactions they have received, the greener they appear.
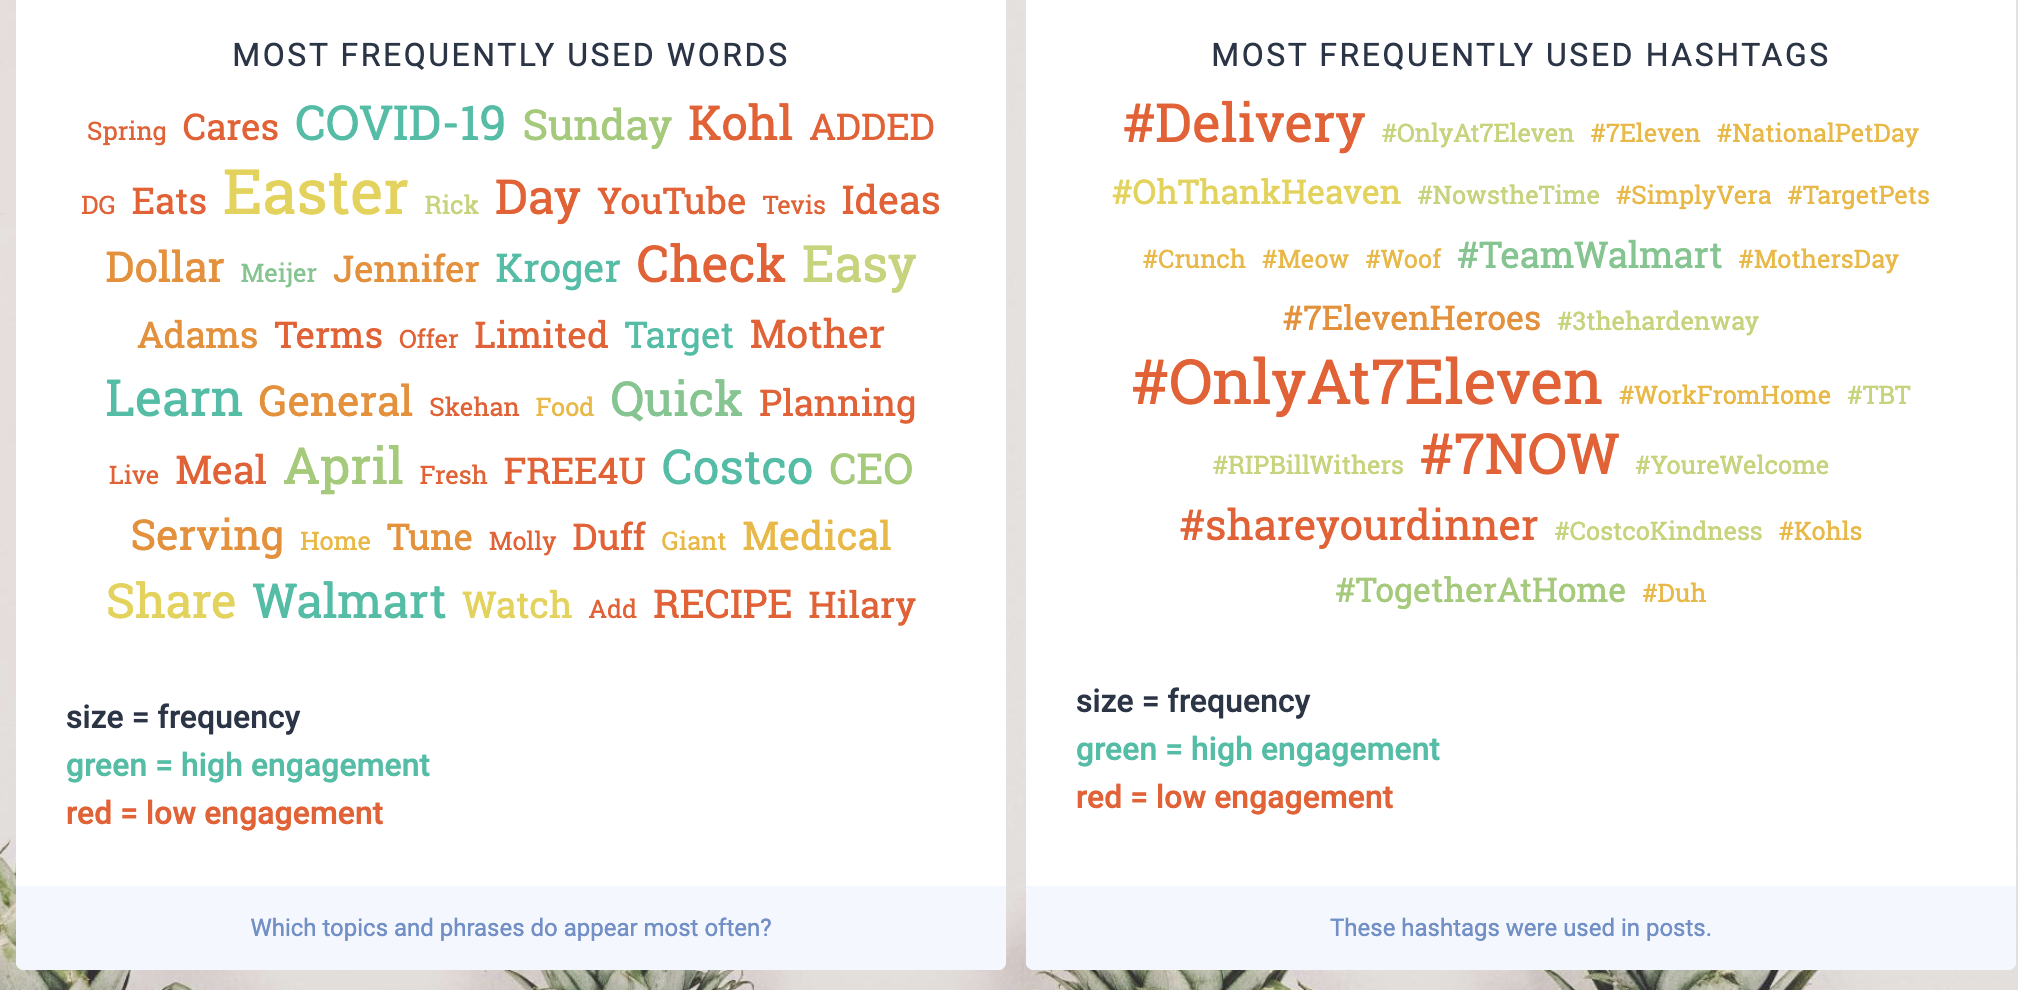
In the figure you can see that, for example, the hashtag #delivery was used often (large) in posts, but those posts received very little interaction (red). Words like “COVID-19”, on the other hand, got a lot of interactions.
If you work through the lists carefully, you will notice many interesting things that will help you to define the interests of your target group so that you can address them more precisely and get them to interact.
Now you know which posts have received the most shares or likes, whether pictures or videos are better received.
Now let’s get to the question: Which topics interest users the most?
3. Tagging
How come one post has gone viral and another has not? To answer this question, and to get closer to the needs of your target group, you need to examine the content of the posts in your industry.
Tagging posts helps you to find out which characteristics of posts are responsible for their good (or bad) reception among users.
To do this, tags are created for different characteristics in pictures, videos or post texts and assigned to individual posts. Once you’ve tagged enough posts, you can evaluate which features cause the most interaction.
How to Create a Social Media Tagging
- Go to a dashboard of your industry in the “Tagging” section (last point of navigation)
- Select a period
- Create tags for individual attributes that you want to examine
- Tag the posts by clicking on the tag buttons below the posts
- Values the results in the “Charts” and “Matrix” tabs
For example, as a travel agent, you could create the tags “beach” and “city” to determine if you’d rather post about metropolitan areas or sunny islands. The example shows that beach posts get more exposure and shares on Facebook than city posts. The social media managers of Holidaypirates, Holidayguru and Tripadvisor had the right instinct when they decided to post more about beaches.


American retailers could ask themselves questions about which foods are more likely to attract interaction “sweets”, “fruit” or “meat”. However, tags do not necessarily have to describe objects, they can also distinguish stylistic elements such as colours, moods or tone of voice. You decide how detailed you want to get.
When you’ve tagged and evaluated many posts in your industry, you’ll know what your content needs to provide so that users will like, comment and share it.
Tip: You can create as many tags as you want and assign as many of them to each post as you like. If you leave a post without a tag, it will automatically receive the tag “untagged posts”. With the help of this tag, you can exclude all posts that are not relevant for your analysis.
4. Finding the Perfect Time to Post
For more reach, it is not only necessary to produce particularly good content, but also to publish it at the right time, exactly when your target group is online and active on the network.
Fanpage Karma’s daytime analysis shows you when you can expect a lot of interaction for new posts.
This is how you go about it
- Create a dashboard to which you add all relevant competitors in your industry (important: make sure that you add enough profiles that address the same target group as you do)
- Go to the Analysis section, where you will find the daytime graph
- Select a period in the upper right corner (the longer the period, the more posts are included in the analysis)
- Check the two boxes below the graph to exclude outliers and imbalances between the profiles from the result
Tip: Perform the daytime analysis for each network individually. Since the individual networks have different characteristics and distribute posts differently, a mixture would falsify the result. Instagram posts, for example, are much more durable than tweets and therefore receive interactions longer. To exclude profiles or networks from the analysis, click “hide” (eye) in the bar on the left.
Evaluate Result
The graph shows you at which times of the week most posts were made (size of the circles) and when there were the most interactions (color of the circles):
- the greener the circle, the more interactions took place
- the bigger the circle, the more posts were made
→ The best time to post is where the circles are greenest. This is where there has been the most interaction in the past. If the circles are green and large, this means that many posts are already being made at this good time anyway. So it makes sense to use the times of the small green circles for your posts, because here you have less competition.

Tip: Click on the circles to display the posts in question.
The example shows that American retail companies should post on Tuesdays, Wednesdays, and Sundays in the morning around 10 o’clock.
Your turn!
Now you know how to evaluate what kind of content your target group likes best and when you should publish it. The results will give you the clues you need to improve your posts so you can get more interactions and reach in return. Let’s go for it!
Got any questions? Then let us know at service@fanpagekarma.com!