Are you responsible for reporting regularly on the performance of social media profiles and presenting the results to your client or boss? Then you know that this can be quite complex.
This guide will show you how to quickly retrieve, visualize and export data, create reports and report templates, and automate the reporting process within Fanpage Karma.
(Click to enlarge screenshots.)
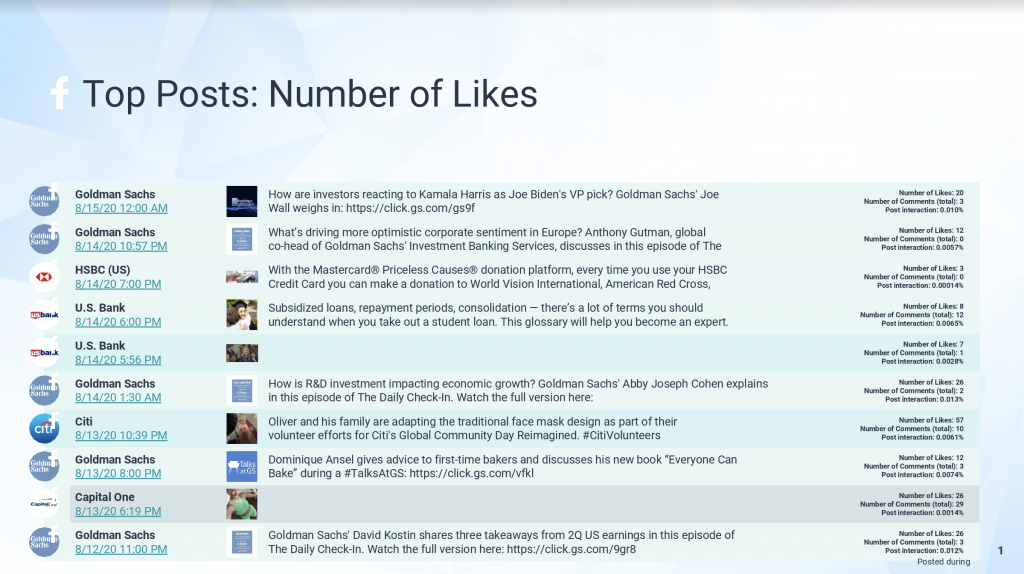
1. Top Posts Report
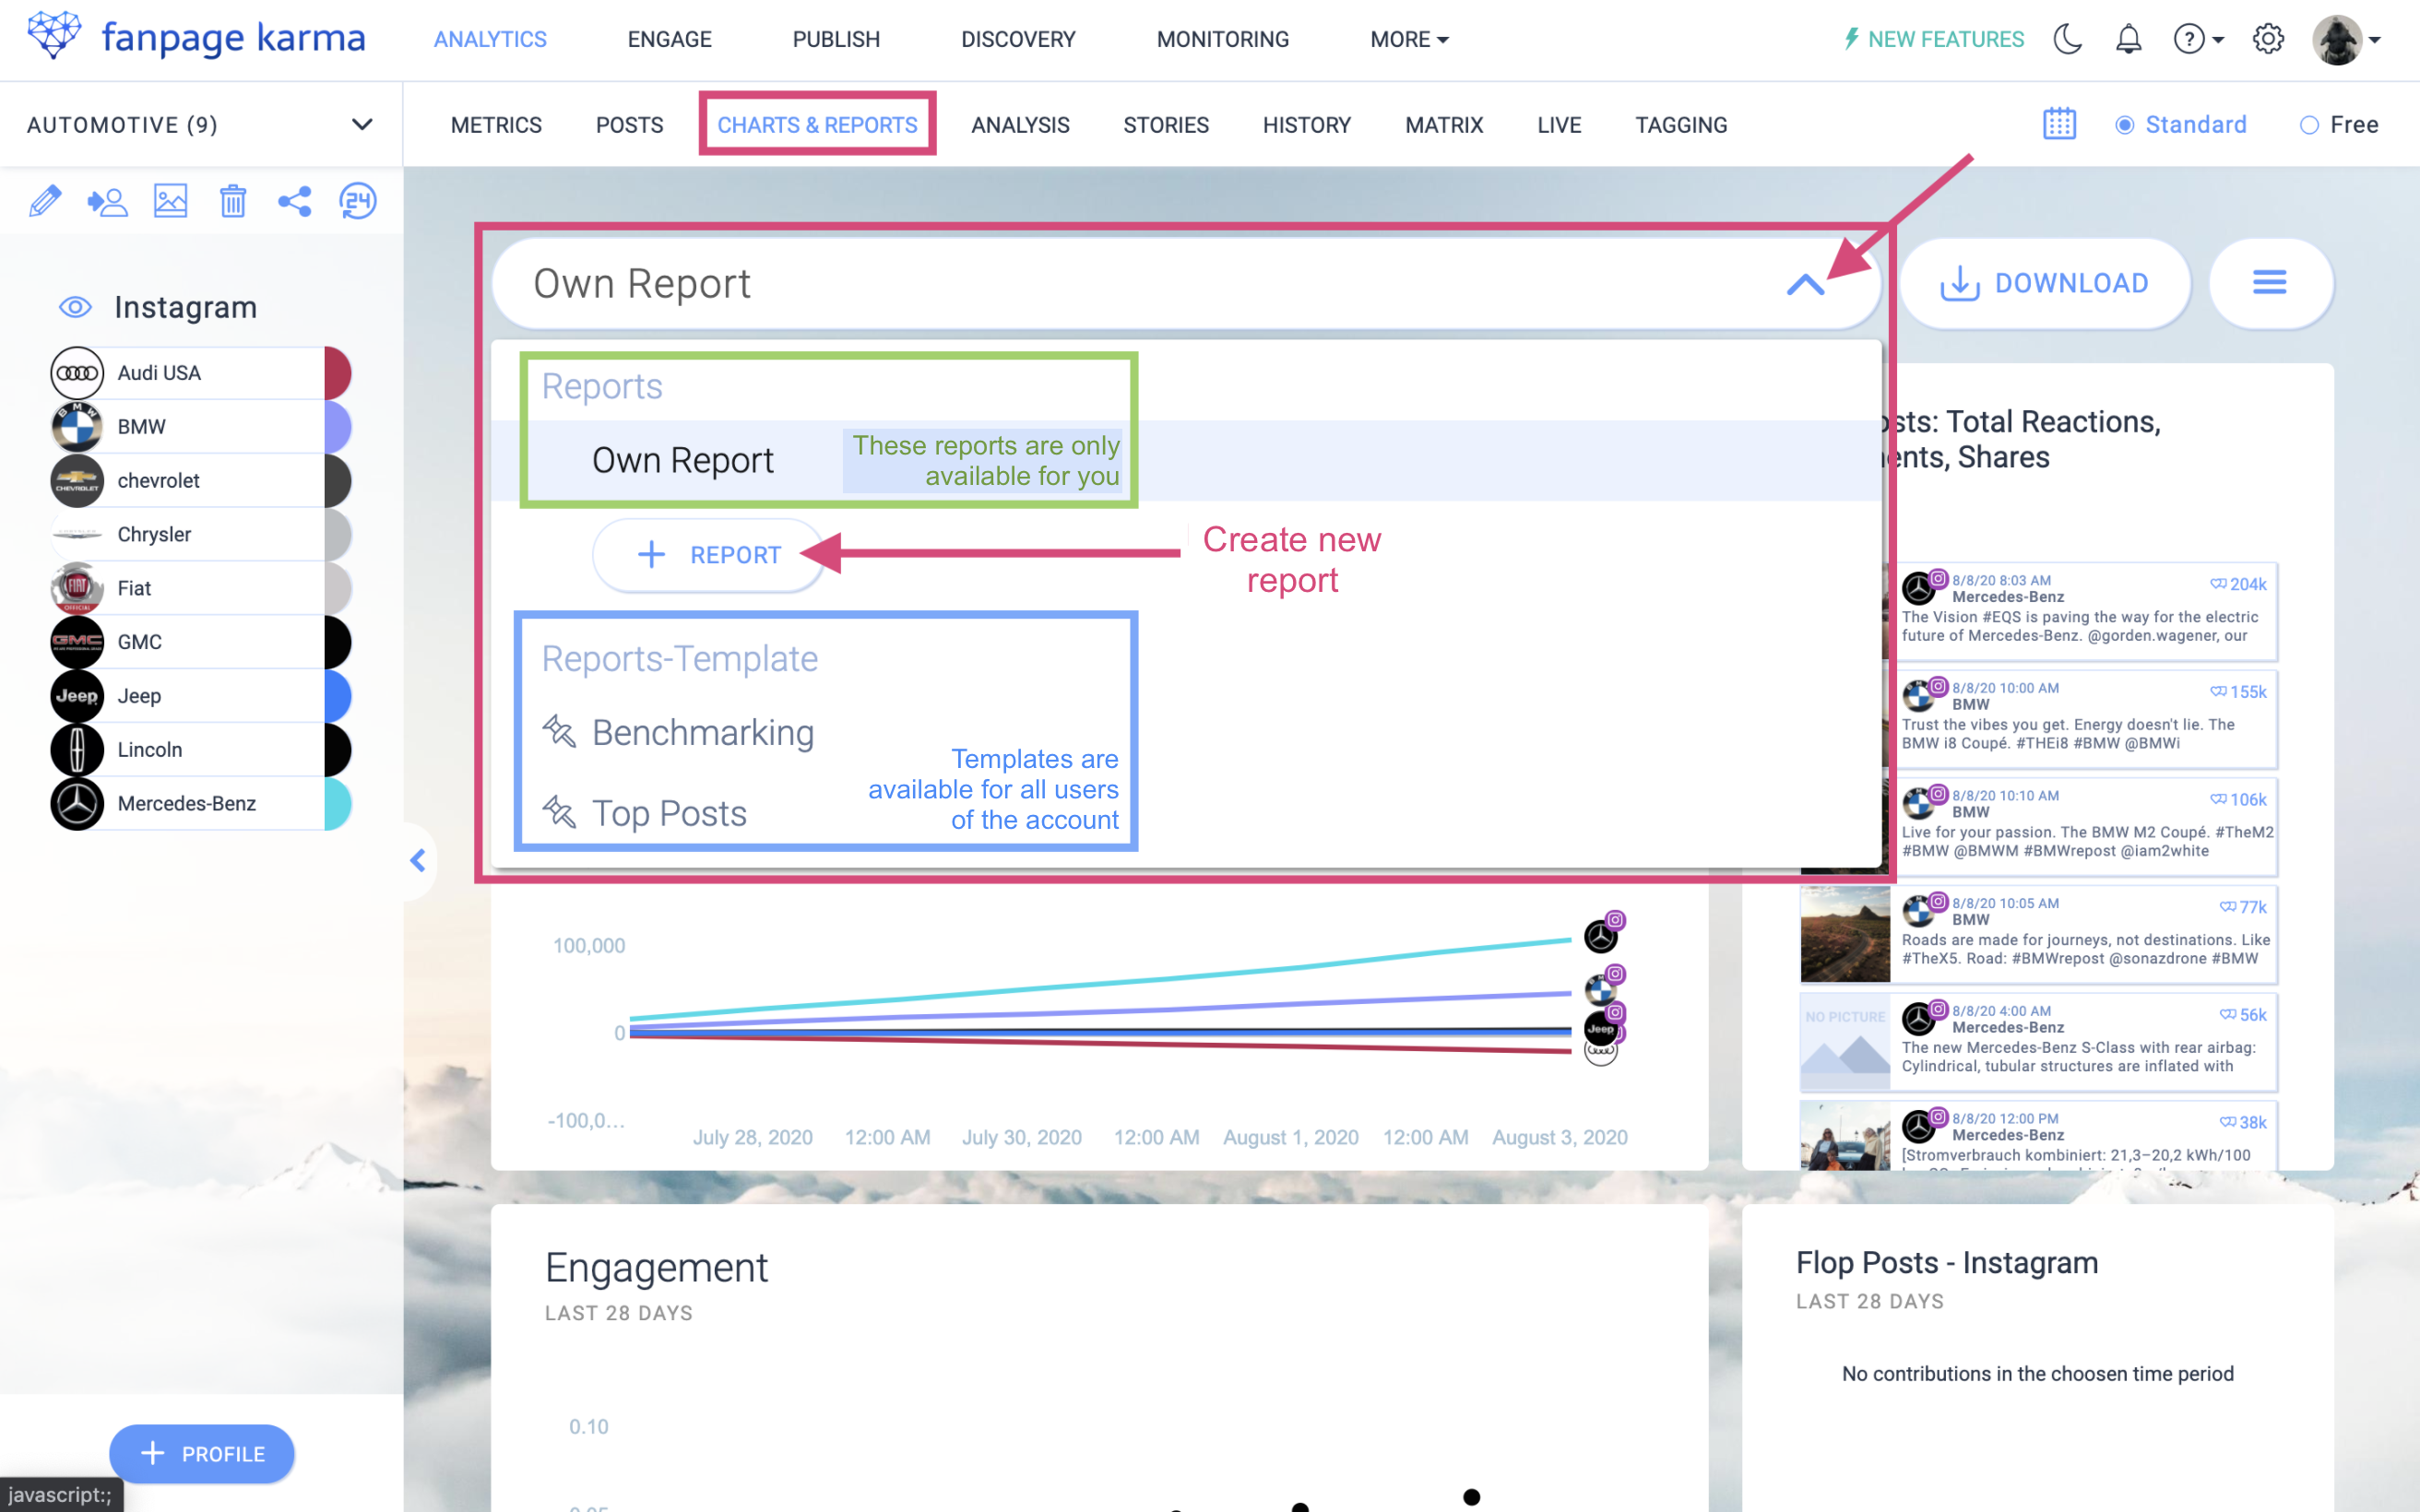
Do you want to show how well the posts of your company or the whole industry have performed? Then the top posts report is exactly what you need. You can find it among the report templates by clicking on the report dropdown.
The report uses various graphs to show how actively the profiles have been posting, what the best and worst posts have been and what times are suitable for posting. How to read the report:
- Find the highest points in the engagement graph: these are the posts that received the most interactions per follower (the colour of the points indicates which profile it is)
- Look at the post lists below to see the posts that performed best and worst (click on a post to open it on the network)
- Check the weekday graph to see on which days the profiles posted the most
- Look at the time of day graph below: the greenest circles indicate the best times to post, as this is where most post-interaction took place
- Use the results from (3.) and (4.) to make a statement about whether the profiles have posted in good times
- Look at the keyword cloud and find the topics that got the most interaction: The greener the term, the more successful the topic
- Export the report under “Download” as PowerPoint or PDF

After presenting this report, your listeners will know how good the company’s posting strategy is and where there is room for improvement.

Tip: Have the top posts report sent to you monthly as a PowerPoint. Then you can present the previous month’s figures right at the beginning of the month and don’t even have to prepare yourself. Just click on the “Download” button in the top right-hand corner and tick the appropriate box. You will receive the report every third of the month by e-mail.
2. Benchmarking Report
Do you want to show how well your company performs in comparison to the rest of the industry? Then you should use the benchmarking report. You can find it under the report templates by clicking on the report dropdown.
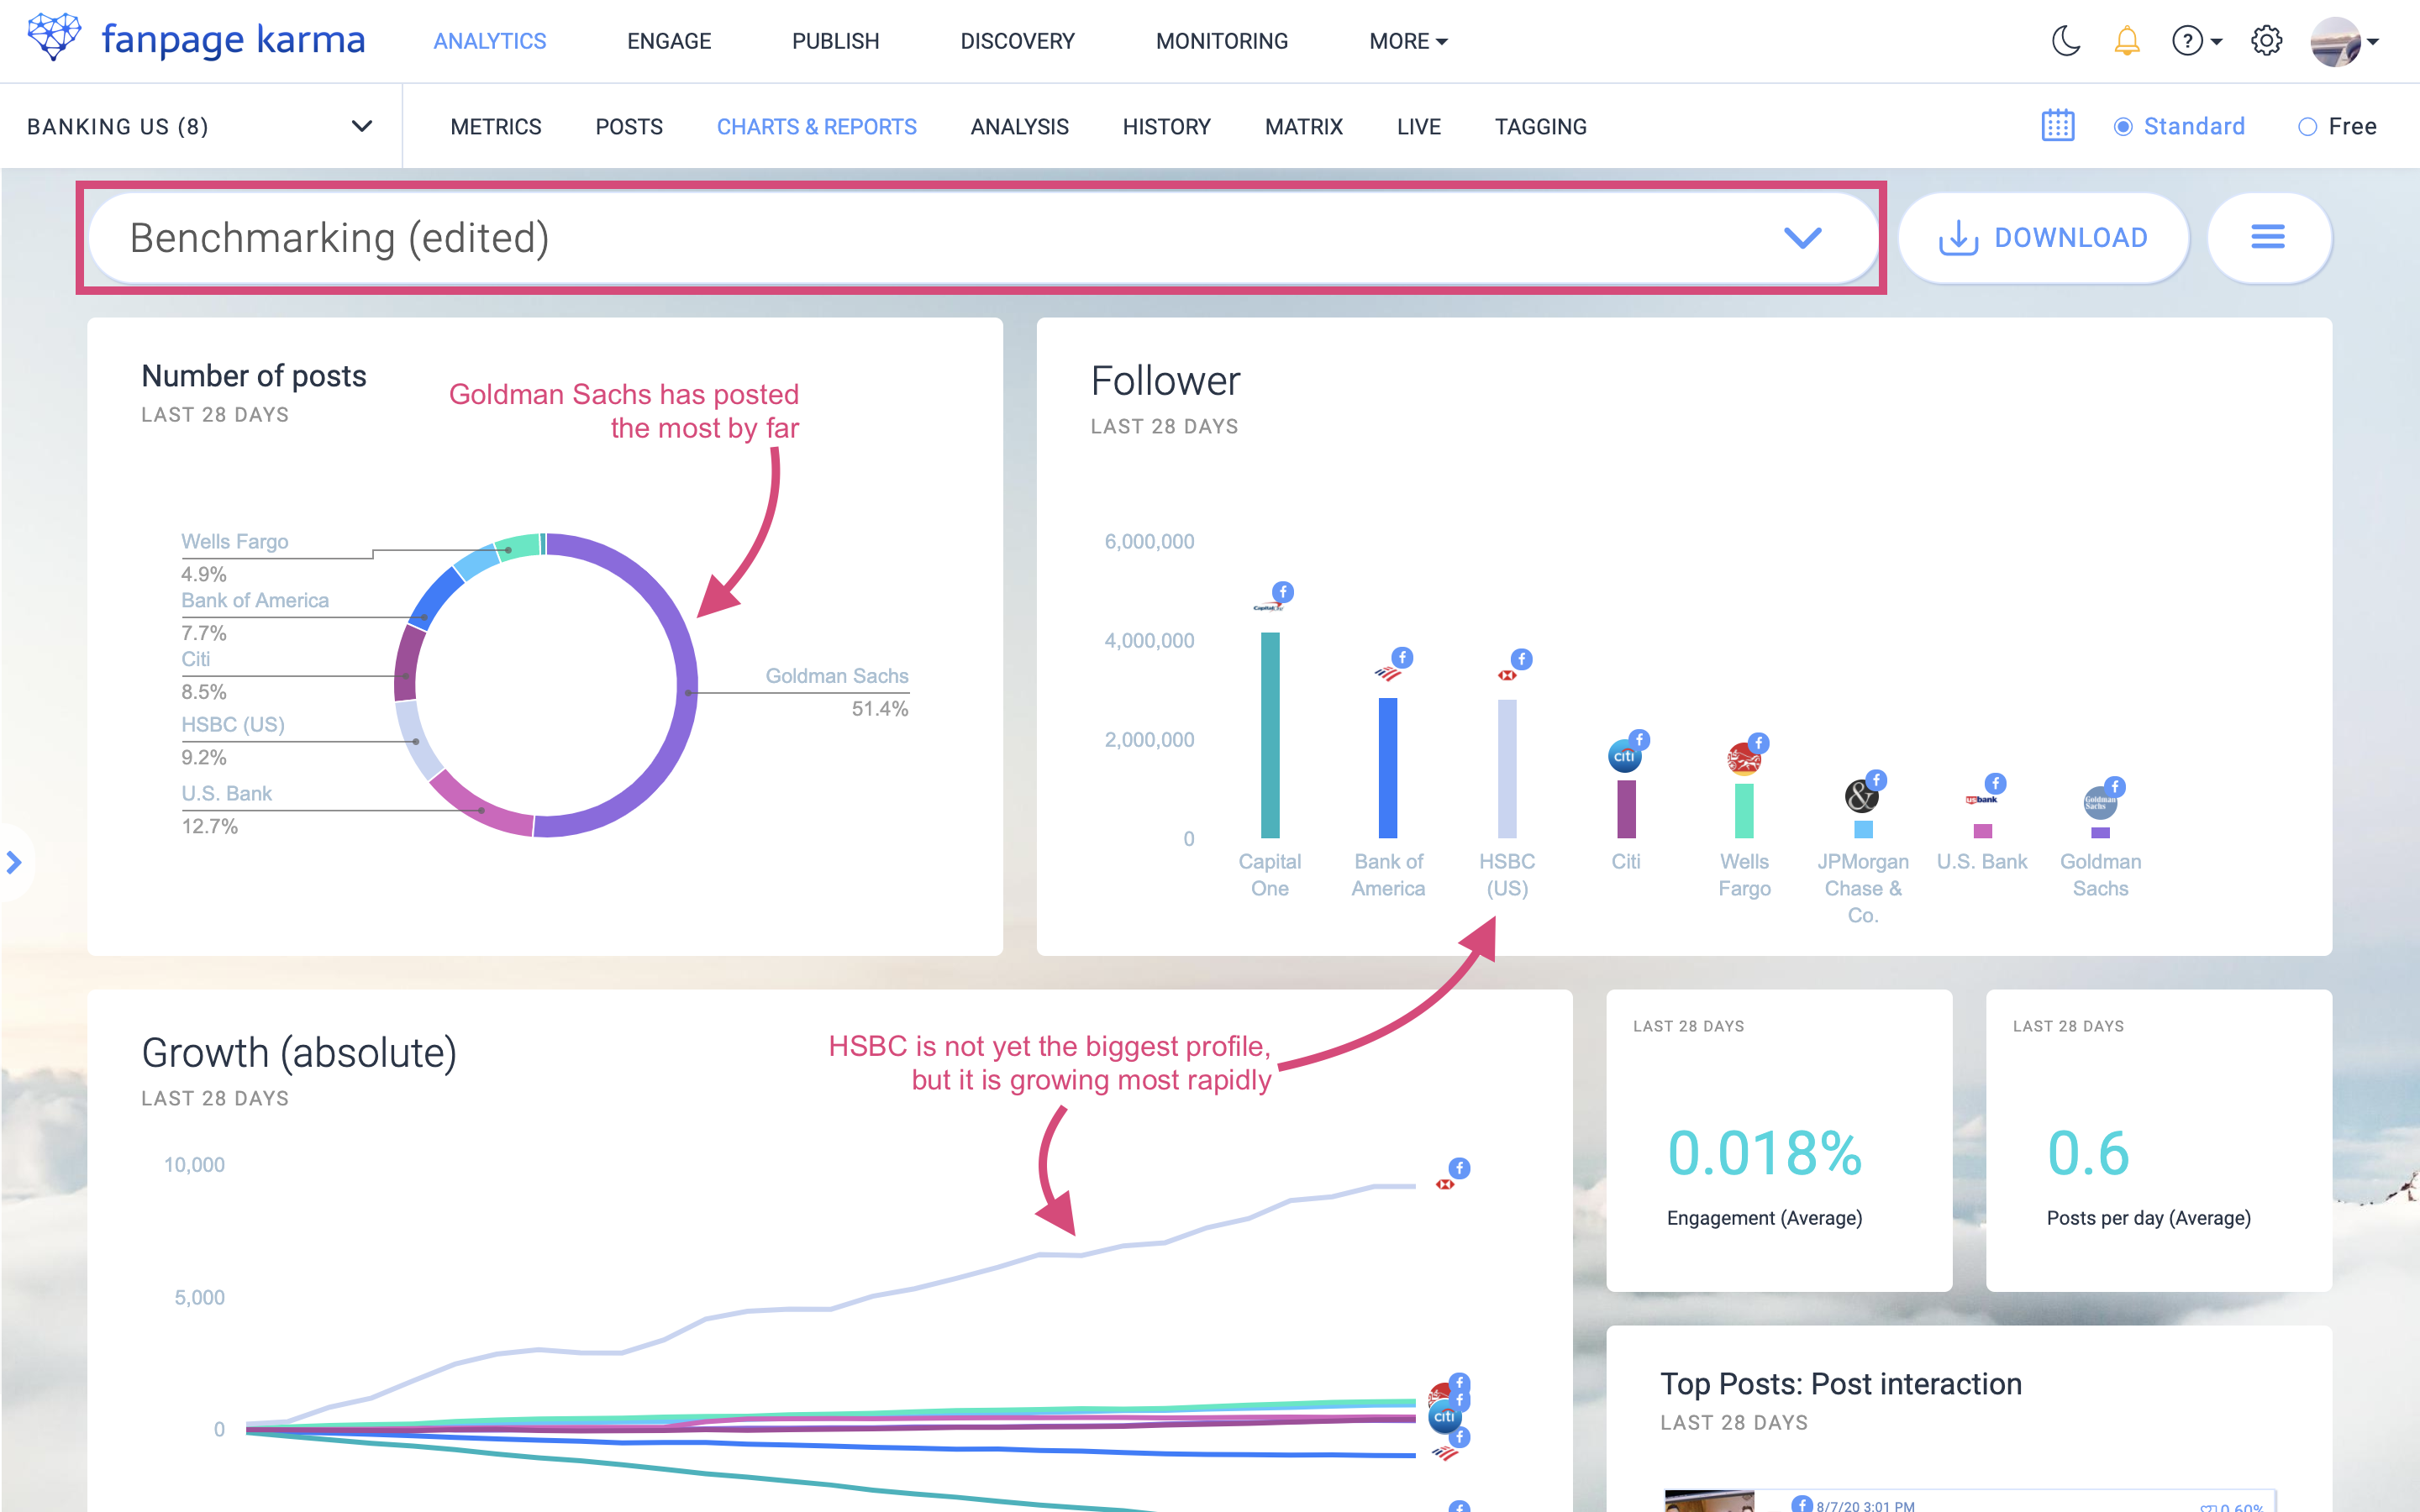
The graphs in the report help you to see how strong your social media presence is compared to other profiles in the industry. How to read the report:
- Check the follower graph to see which profiles have the most followers and where your company is positioned
- Determine which profiles have grown the most in the growth graph and check out where your profile stands
- Identify who has made the most posts in the pie chart
- Compare the results from (1.), (2.) and (3.) and ask yourself for example: Is there a profile that is the strongest in all three points? Does your own profile dominate in any of the areas?
- Export the report under “Download” as PowerPoint or PDF
After presenting this report, your listeners will have a clear overview of how the company compares with the rest of the industry.
Tip: Have the benchmarking report sent to you monthly as a PowerPoint. Then you can present the previous month’s figures right at the beginning of the month and don’t even have to prepare yourself. Just click on the “Download” button in the top right-hand corner and tick the appropriate box. You will receive the report every third of the month by e-mail.
3. Create Your Own Report
A major benefit of the chartboard is that you can create different reports for the same dashboard and switch between them. Maybe you want to create a reach report for your own profiles on the one hand and a benchmarking report for the profiles of your entire industry on the other.
This is how you create your individual report:
Go to the Charts & Reports section of the dashboard of your choice
- Click “+ Chart”
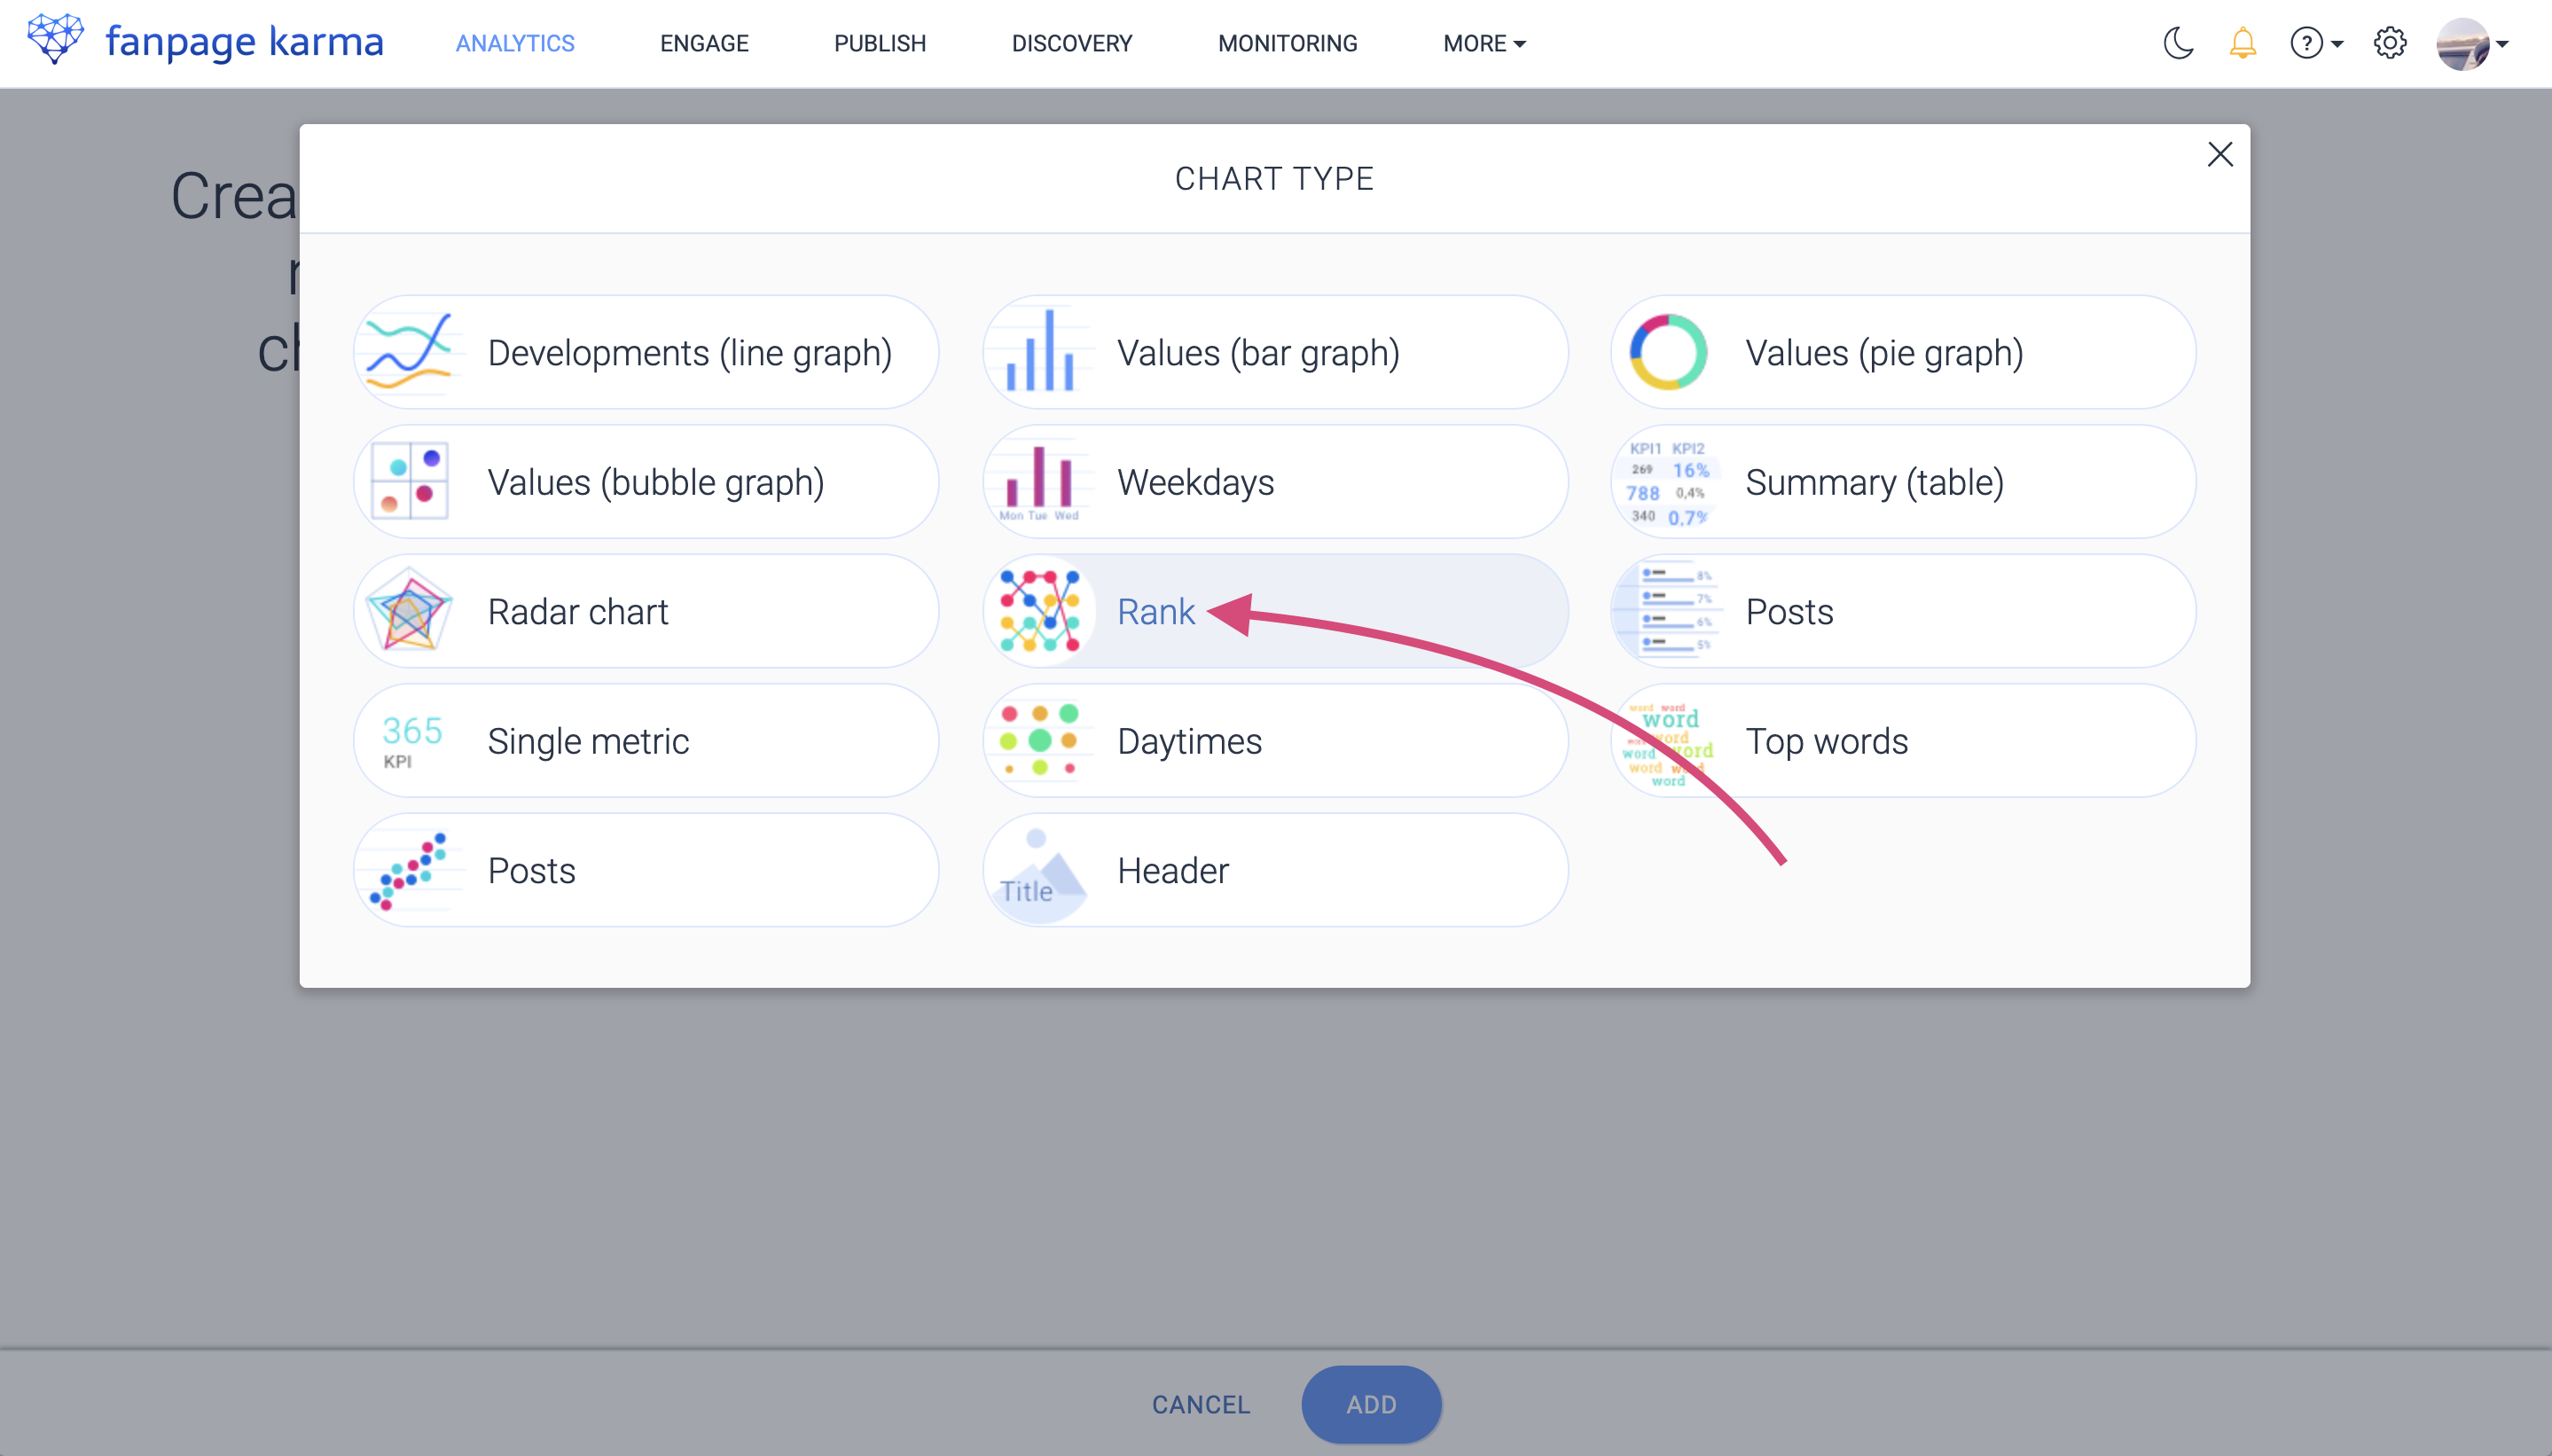
2. Select a type of graph from the drop-down menu at the top
3. Choose which profiles should be shown in the graph (if you have a lot of profiles in the dashboard, it is a good idea to show only the top 10)
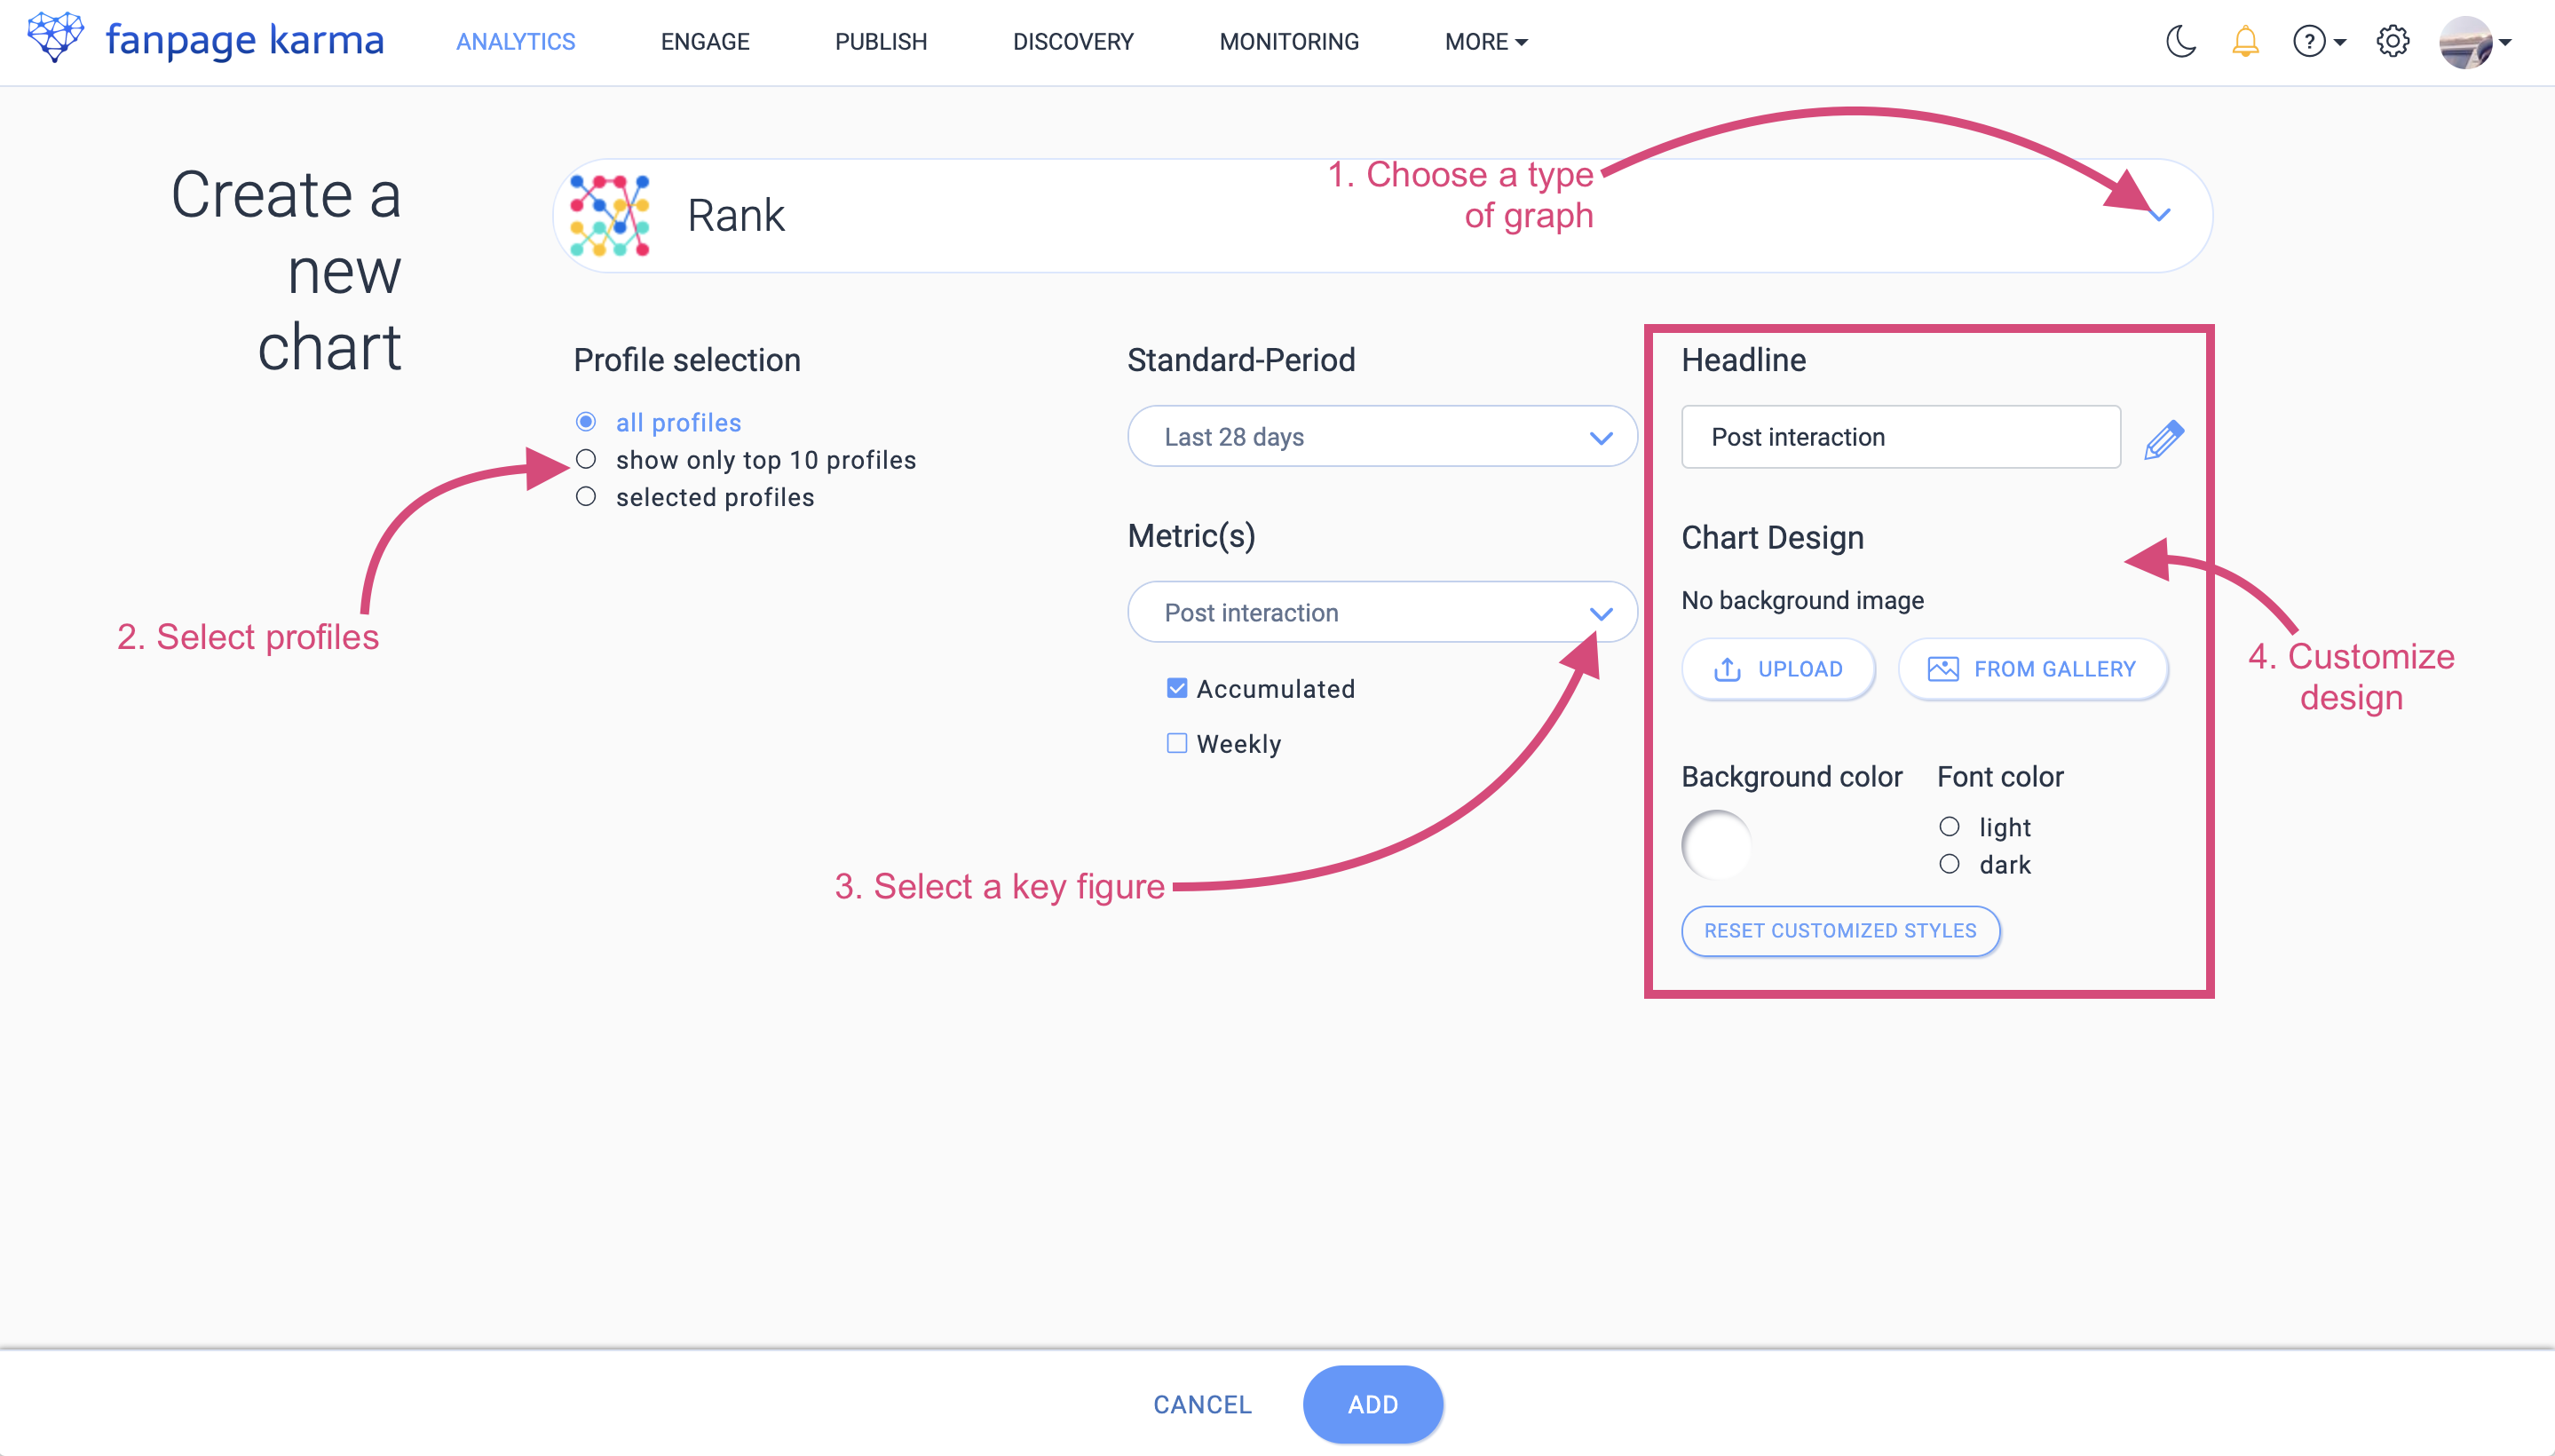
4. Select a key figure
5. Optional: make your chart more attractive by adding a background image
6. Repeat the process until you have created enough charts
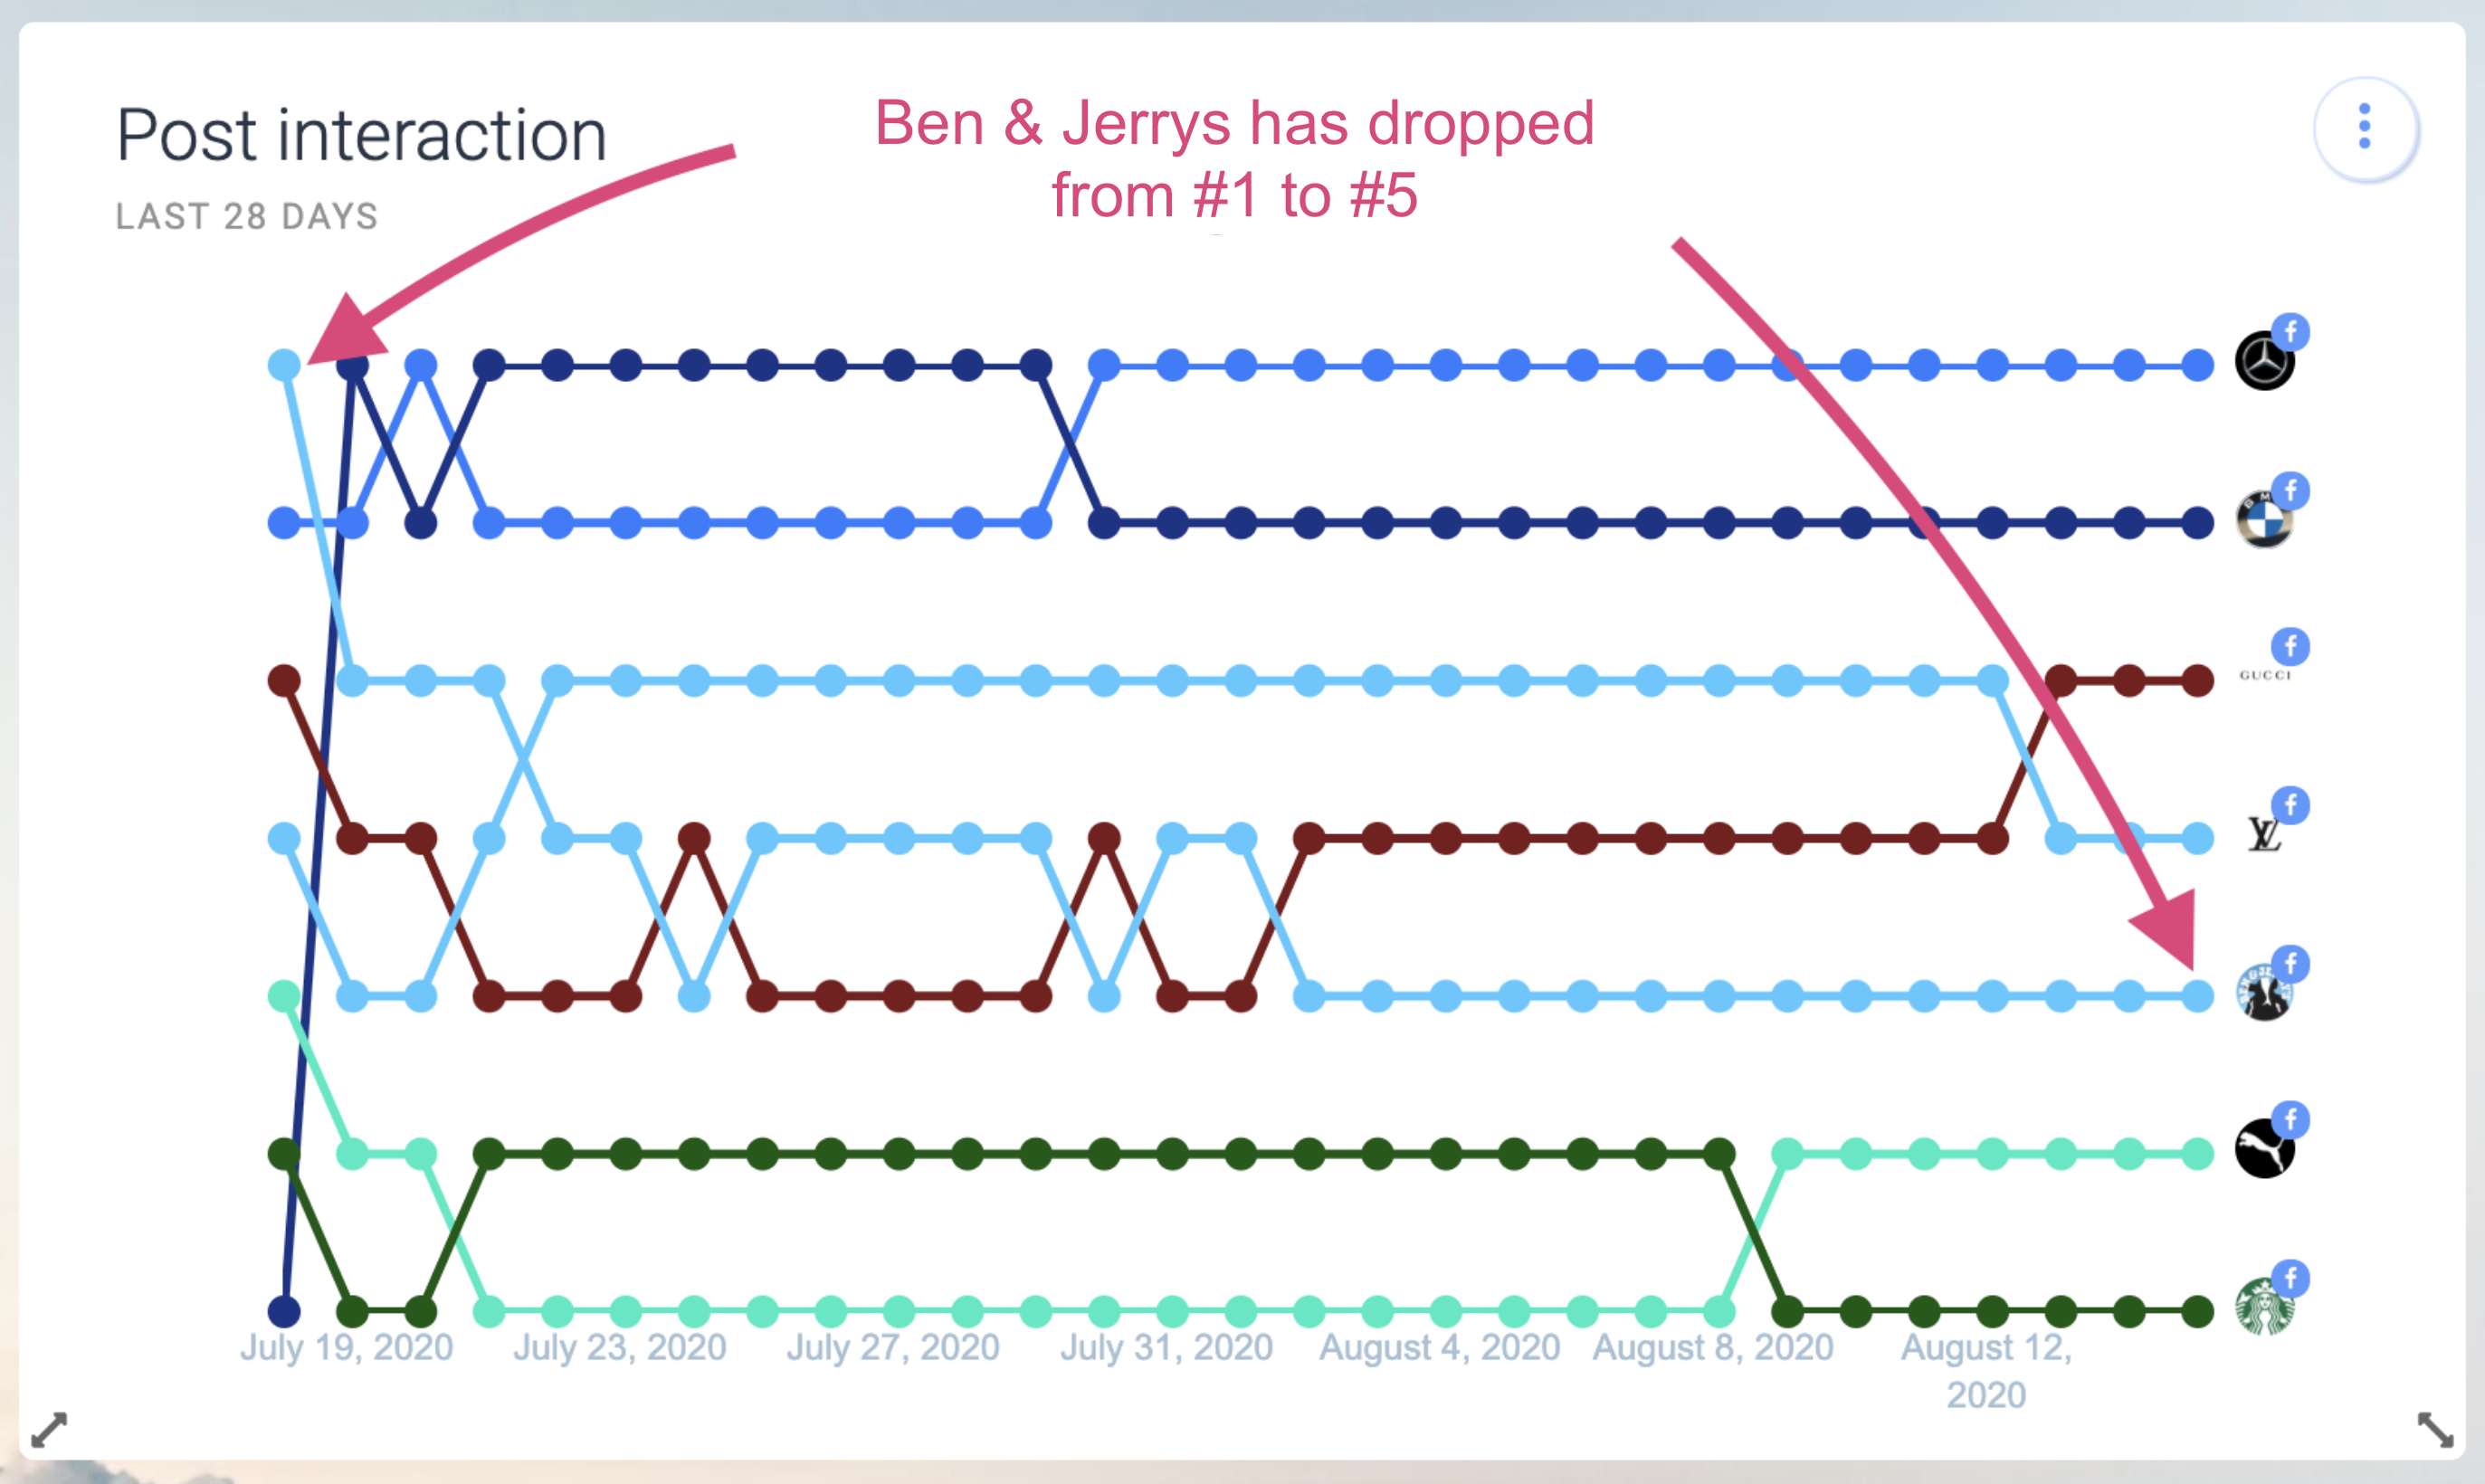
Tip: Create a ranking graph to show which profile is ahead. In the example, you can see that Ben & Jerry’s first showed the highest post interaction, but was then overtaken by Mercedes, BMW, Gucci and Louis Vuitton.
7. Position the charts by drag and drop
8. Scale graphs by dragging the corners
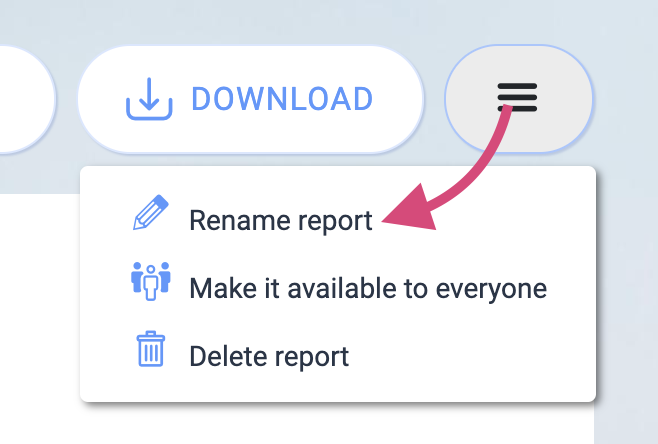
9. Give the report a name by clicking on the burger menu and then clicking on “Rename report”
You can now find the report under Reports in the drop-down menu of the dashboard.
Tip: These 3 key figures must not be missing in any report:
- Total number of interactions: the absolute number of reactions, comments and shares (for Facebook, for Instagram it would be likes and comments)
- Post interaction: the number of interactions relative to the number of followers (makes it possible to compare profiles of different sizes)
- Weekly growth: the average gain in followers per week
Once you have created a report, a template can be created from it that can be used by all team members.
4. Create Your Own Report Templates
If a report is relevant for the whole team, simply create a template from it and it will be available to everyone. The reporting process is thus made much easier. Different team members can very quickly create consistent reports on different social media profiles.
Creating a report template is very easy:
- Open the report dropdown by clicking on the header of your chartboard
- Select a report or click on “+ Report” to create a new one
- Create charts according to your requirements
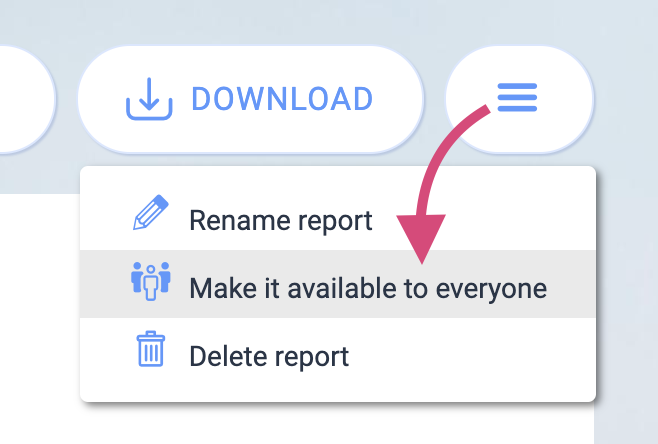
- Click on the burger menu in the top right corner and select “Make available for all”.
The template is now available to all members of your account and in every dashboard.
5. Public Dashboard: A Dynamic Report for Your Customer
A slightly different form of reporting, that allows you to give external people permanent access to analyses and reports instead of making exports for them, is called a Public Dashboard. It gives them the ability to track the latest activities and download reports on their own at any time.
Unlike a regular report that you compile and send or present to a customer or colleague once, for example to show the success of a particular month, the Public Dashboard is a continuous and dynamic report that includes both historical data and the latest activities of today. This way you get much more than just a snapshot of the state of social media profiles.
The customer or colleague finds himself in the dashboard interface of Fanpage Karma and can click through the table, chartboard, post list and many other analyses that you have prepared especially for him. You only have to invest time once to nicely display the most important KPIs using various analyses and graphics. From then on, the customer or colleague can access them continuously and independently. The Public Dashboard serves you as a permanent basis for transparency, feedback and strategic planning.
Here you can find a sample dashboard (password: 12121)
How to Create a Public Dashboard
- Create a dashboard with the profiles that are relevant to your client or colleagues
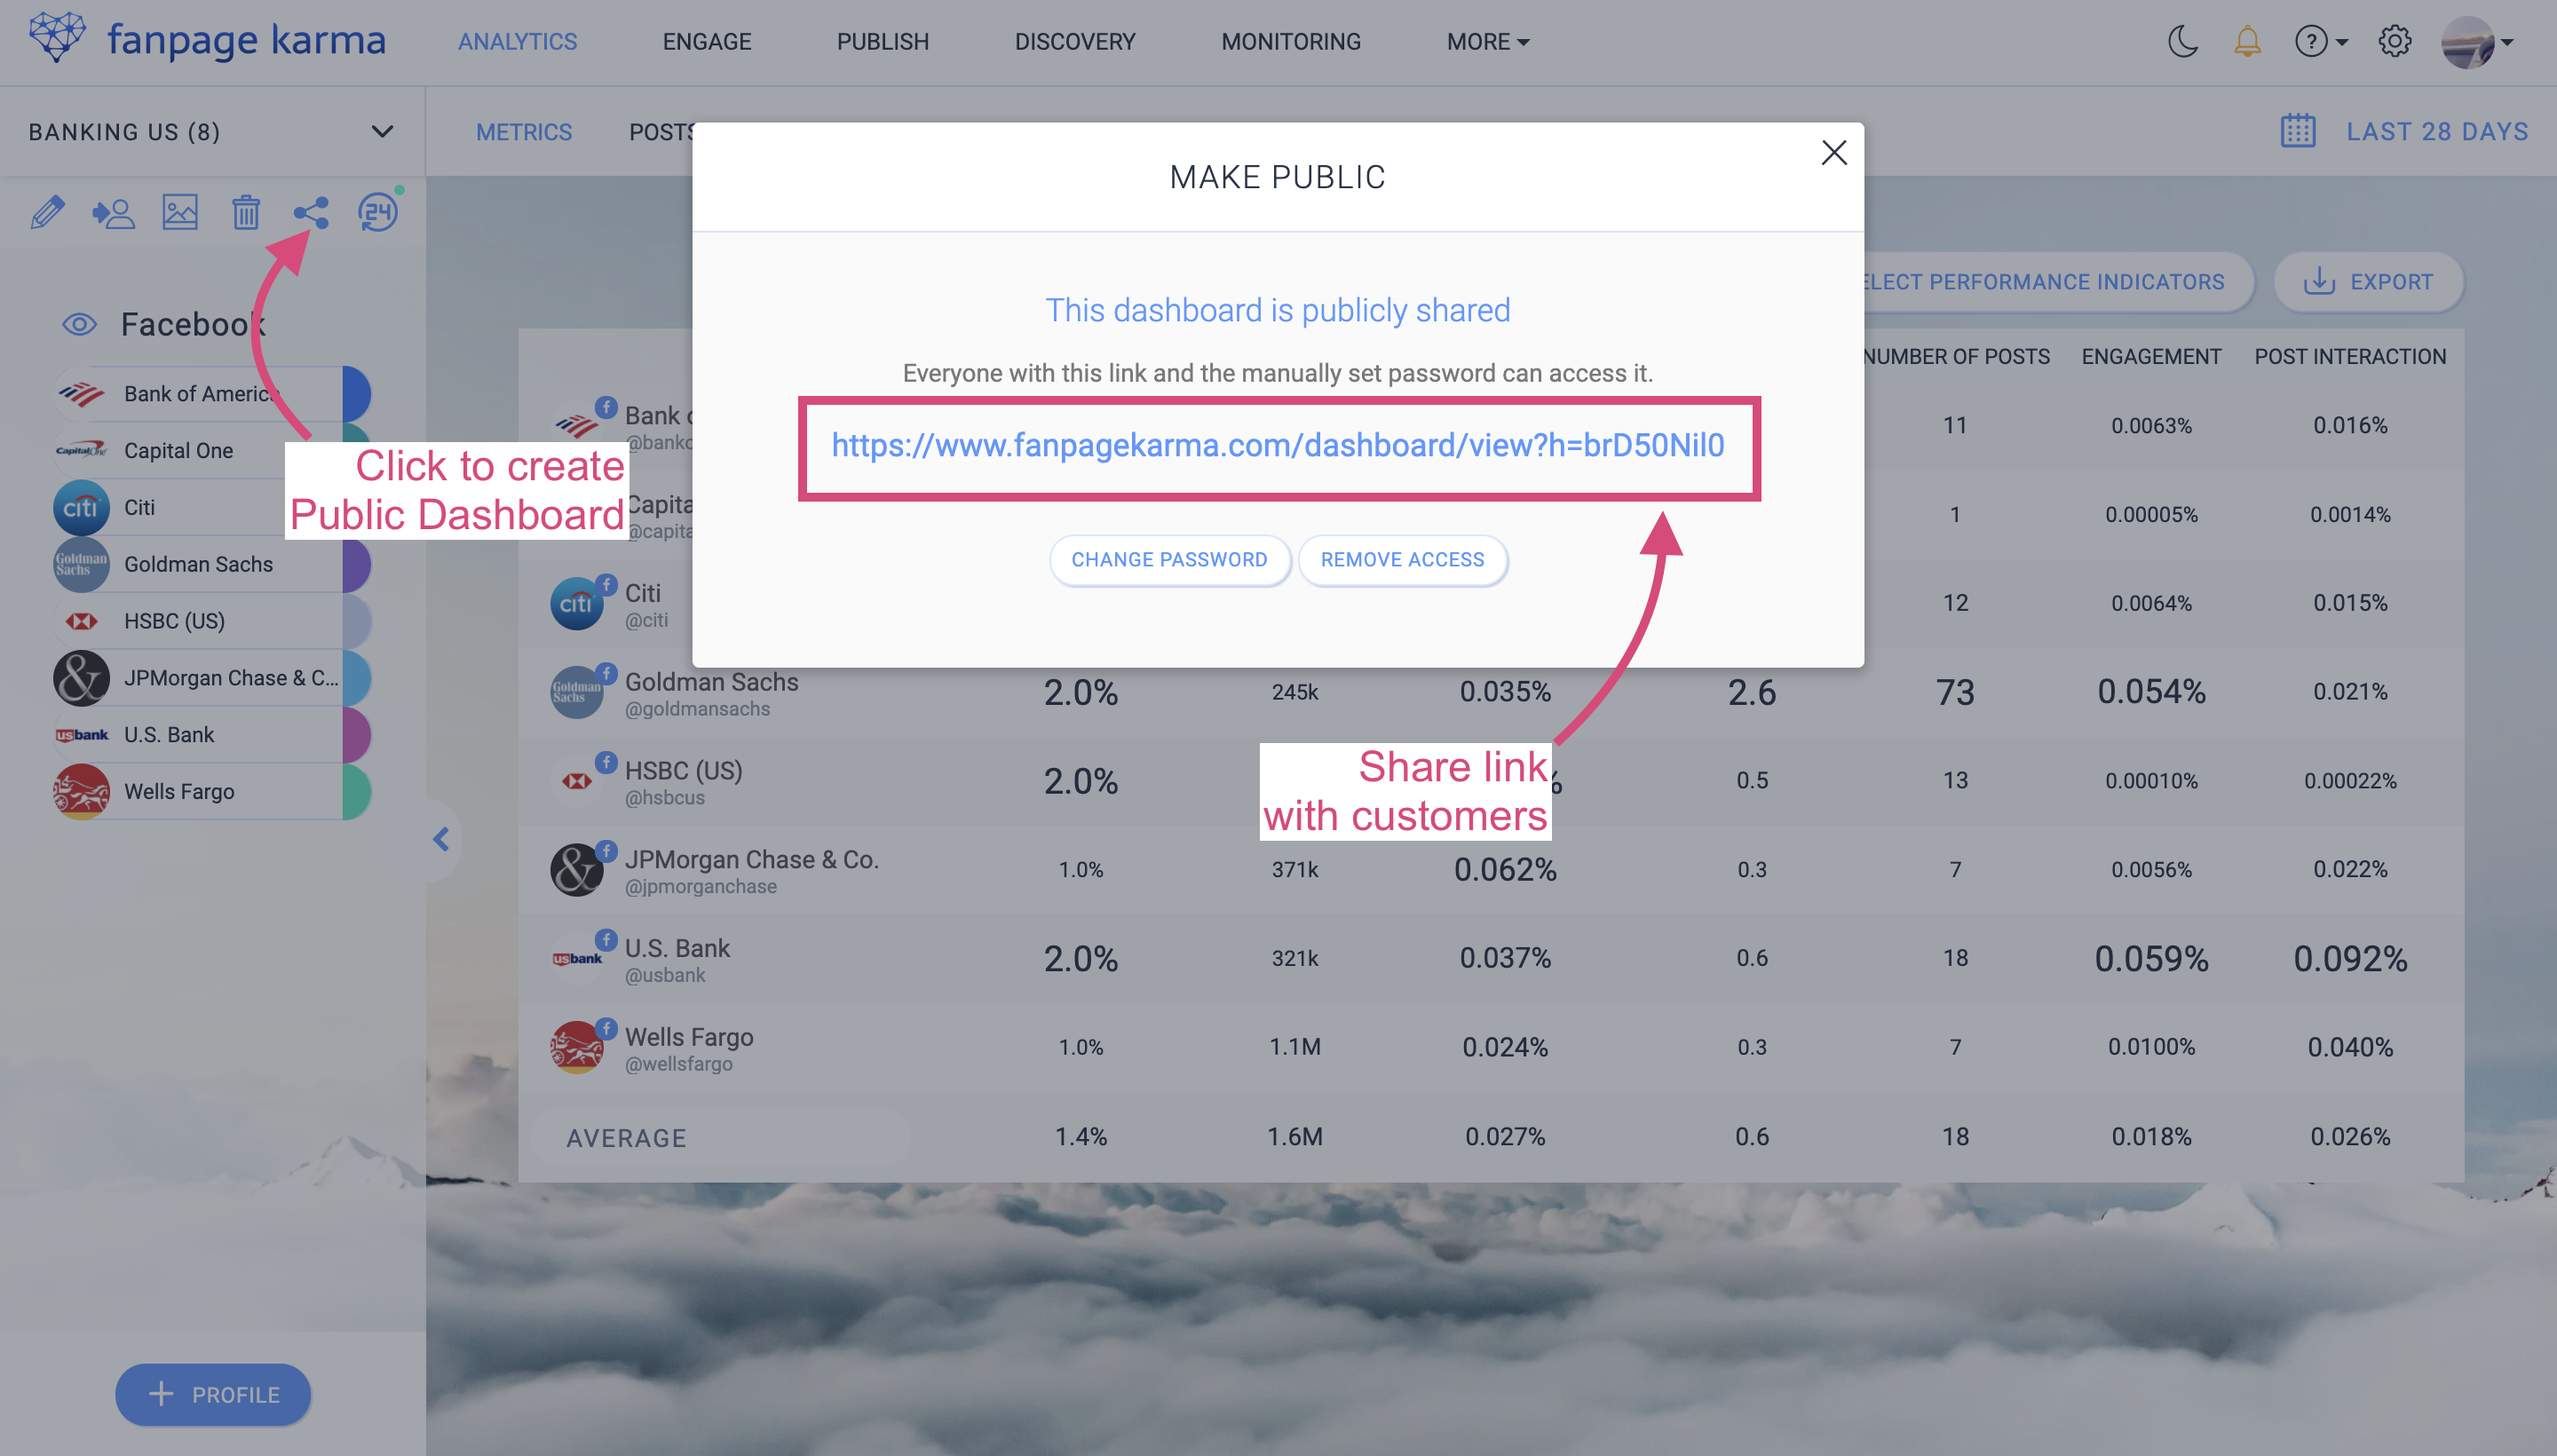
- Click on the sharing button in the left bar
- Assign a password and click “order with payment”.
- Share the link and password with all persons who should be able to access the Public Dashboard
Anyone you share the link with can access the dashboard by entering their password. To change the password or deactivate the link, click the button again.
These functions are available to the customer within the Public Dashboard
- Metrics table, post-lists, charts, history, live analysis
- Permanent access to the dashboard (until you disable the link)
- Adjustable period for all analyses
- Retrieval of historical and live data
- Download of reports (Excel, PowerPoint, Pdf, CSV)
- KPI Report
- Post lists
- Chartboard
But don’t worry, your client or colleague cannot add or remove profiles, change KPIs in the table or customize charts. They only have visitation rights, so to speak. That way they don’t have to worry about how things work, they can’t change anything and you know exactly what they’ll find.
Of course, you can always customize the Public Dashboard if you want to. To do so, you need to log in to Fanpage Karma, access the dashboard and make changes (e.g. create and scale charts, add profiles, etc.) All adjustments are automatically transferred to the customer’s Public Dashboard.
How to prepare the Public Dashboard for your customer
To give as much value to the Public Dashboard as possible for your customer, you can do the following things.
- Set Background – Set a custom background for the dashboard that matches the industry or companies you are evaluating.
- Select key metrics for table – Select the KPIs in the table that you use to measure your success. This way the customer can see at a glance in which areas you have done a good job and where things are still stuck.
- Create, arrange and design charts – In the charts you can really score points. Concentrate on the key performance indicators and create different graphics that put the different profiles in relation to each other. This even works across networks. For example, you can show how big the growth of a company is on different platforms. Once you’ve created enough charts, you can enhance them by scaling and arranging them in a clever way and giving them their own background colors and images.
- Add unlimited profiles – Add as many profiles as you want to the dashboard. In the chart board, you can then choose which profiles to display for each graphic individually. For example, you can create a chart that shows the growth of your competition on YouTube, one that shows the top posts on Facebook, and one that shows the reach of your business on all platforms.
6. Export Complete Lists of Posts
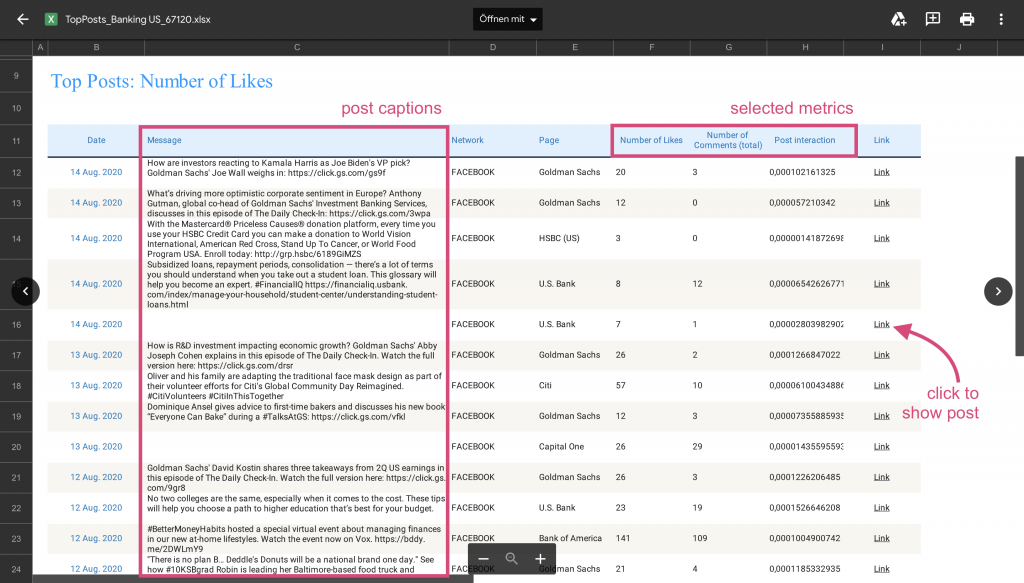
If you want to export the posts of a certain period, you should work with the post list. It lists the items in tabular form and shows how well they performed with regard to certain key figures.
You can find the post list under Posts in the dashboard.

- Select a dashboard with the profiles whose posts you want to export
- Go to the posts section
- Click “Select Key Figures” and select the KPIs that should be included in the report
- Set the correct period for the report
- Select the number of posts to be included in the report in the drop-down menu at the bottom of the list
- Click “Export” and select a file format for download
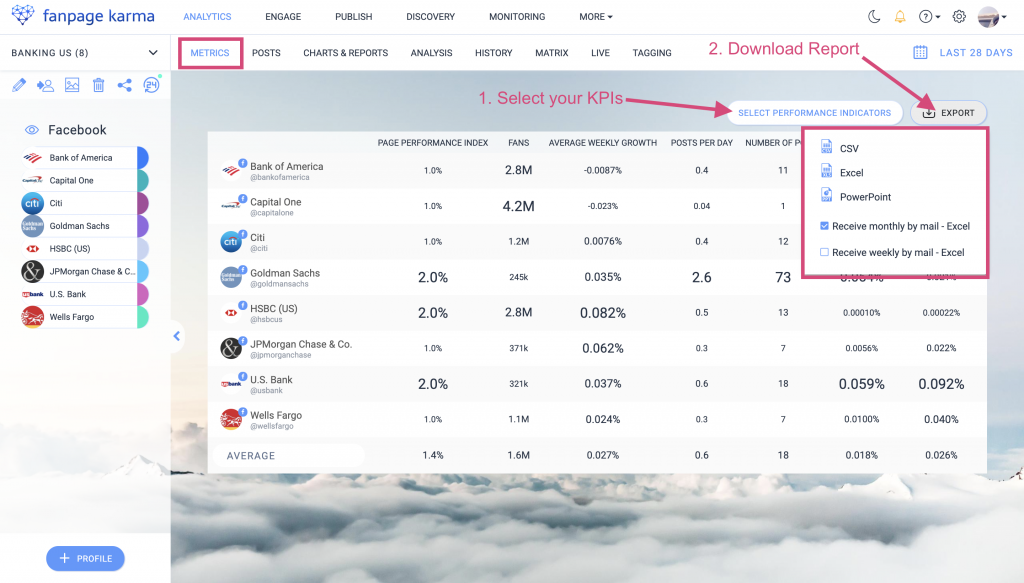
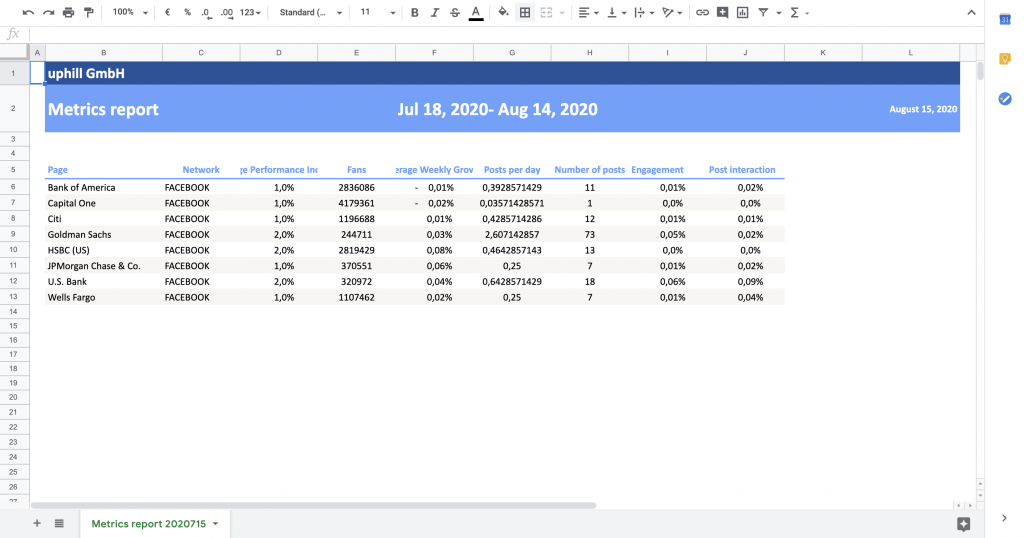
7. Exporting Metrics
If you want to export a large amount of numbers at once, you should use the metrics table. It gives you a compact overview of all KPIs that are important to you. You can find the table under the Metrics tab.
- Select a dashboard with the profiles you want to create the report about
- Go to the Metrics
- Click “Select key figures” and select the KPIs that are important to you
- Set the correct period for the report
- Click “Export” and select a file format for download
Your turn!
Now you’ve gotten to know the different reporting functions of Fanpage Karma and you know how to get numbers automatically, provide them quickly and easily and present them in a neat way. So let’s go for it!
Do you have any questions? Then let us know at service@fanpagekarma.com!