With a social media dashboard you can quickly and easily measure the success of different social media profiles. You can add profiles from the same industry to a dashboard to compare competitors and set benchmarks.
In this article you will learn how to find and add profiles to a dashboard using Fanpage Karma Analytics, how to select and evaluate relevant key figures, and how to export and share data with colleagues.
First Create a Dashboard
- Click on “+ Dashboard” in the dashboard overview
- Give the new dashboard a name
- Click on “+ profile” at the bottom left
- Select a network
- Enter the profile name into the search field
- Select the profile in the search results
The profile is now part of your dashboard and can be found in the panel on the left.
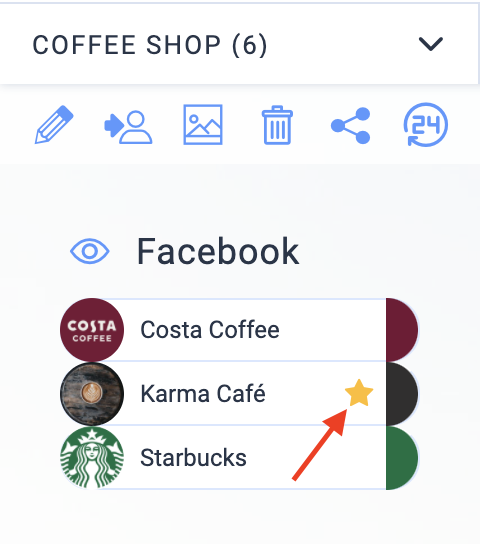
Tip: With a click on “+ my pages” you can add all profiles of which you are the admin at once. As admin you have even more key figures, so-called insights, available for evaluation. Profiles with insights are marked with a yellow star in the dashboards.
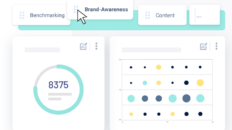
Dashboard Areas
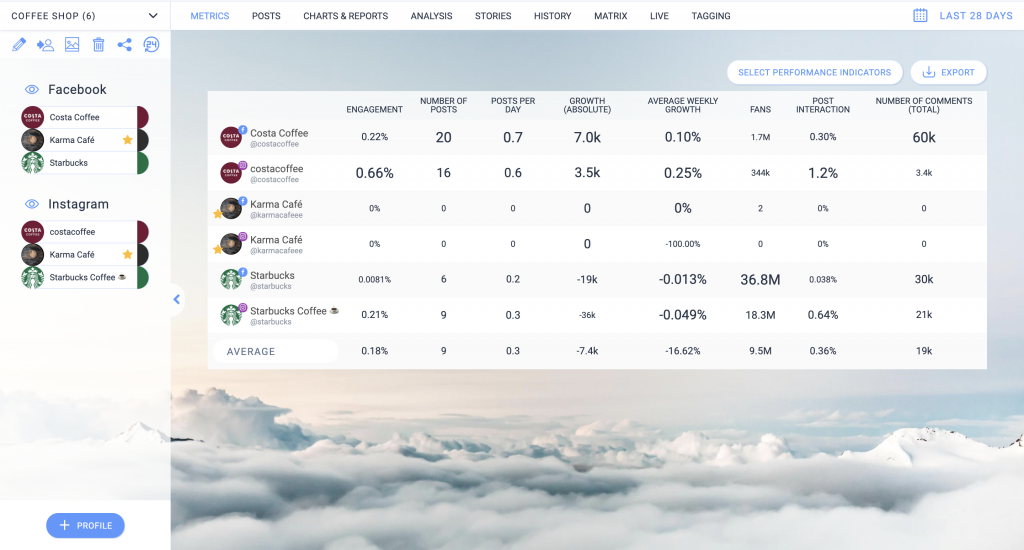
The bar on the left side of a dashboard shows the added profiles of the different networks. In the middle area you will find the analysis area. At the top right you can set the time period for the analysis.
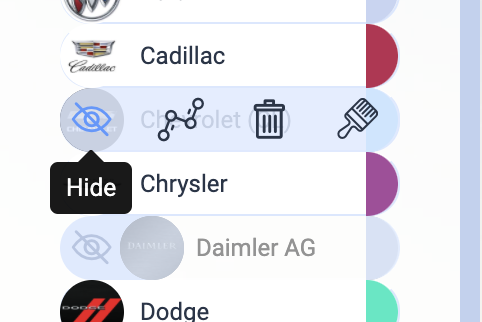
Tip: If you don’t want to analyze all profiles, you don’t have to remove them from the dashboard, you can simply hide and show them by clicking on the eye icon. This way, you can also hide entire networks at once.
There are several analyses available for the profiles added to the social media dashboard.
Metrics Table
The table allows you to get an overview of any number of key figures. You can see at a glance which profile performs particularly well or poorly. Under “Add performance indicators” you can select and adjust the key figures.
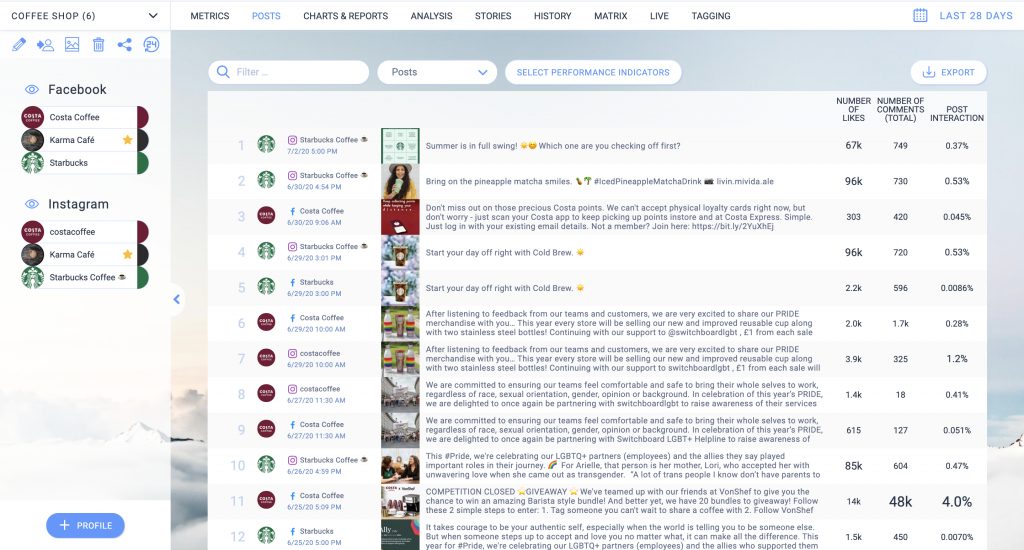
Post List
The post list shows you all the posts made by the profiles in the selected period. The list can be sorted by certain key figures and searched by keywords. This way you can find out:
- what the best/worst posts were (for example by interaction)
- who has posted about certain topics and in what way (for example, enter the keyword “blackfriday” to find out how your competitors have designed their Black Friday posts in the past year)
But be careful: Don’t forget to set the period to the appropriate dates when looking for seasonal campaigns.
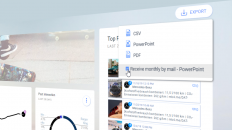
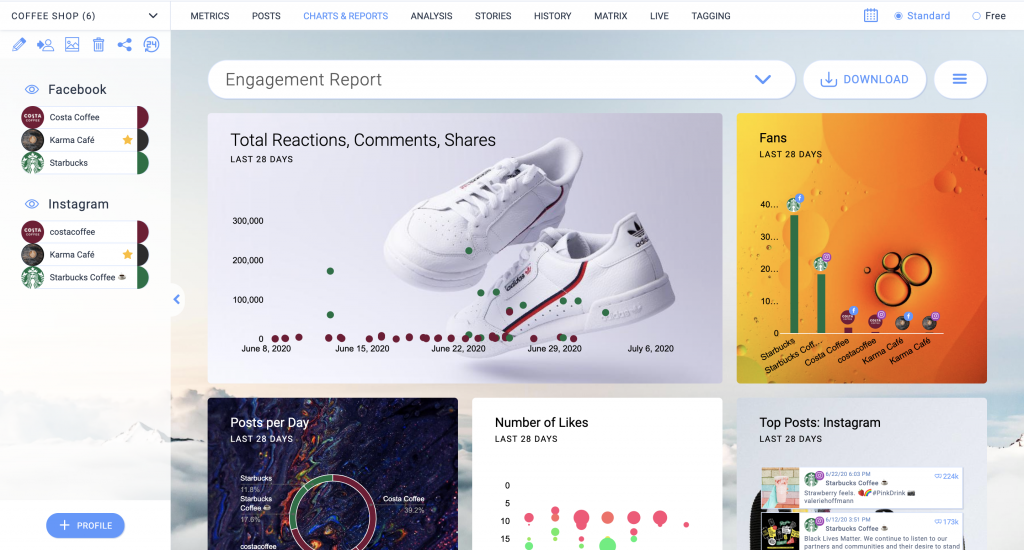
Charts & Reports
In the Charts & Reports section you can freely create charts to visualize data and create reports that you can make available to all members of your account as report templates.
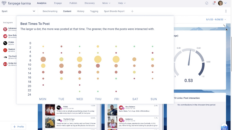
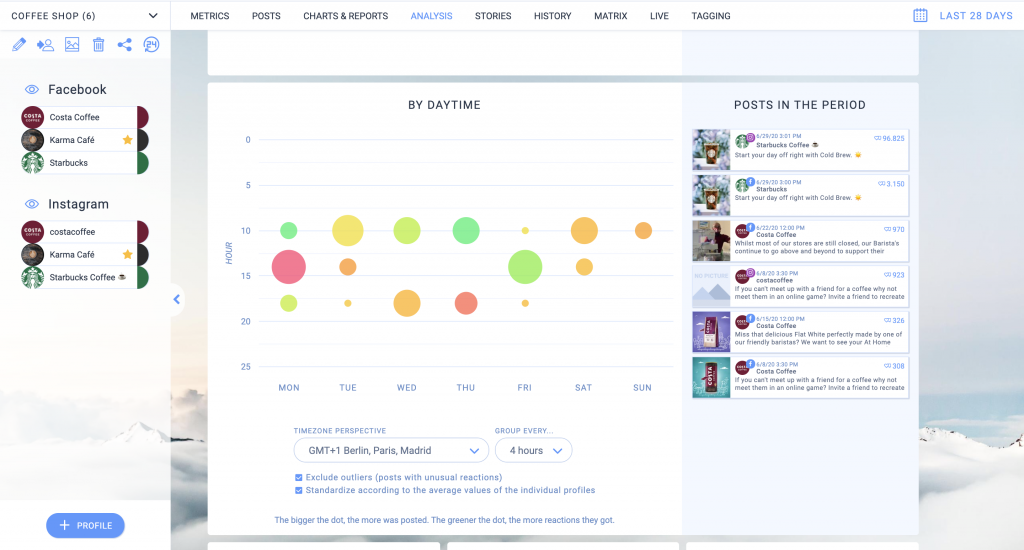
Analyses
Under Analyses, you will find for example the top posts, top hashtags or the daytime analysis, which helps you find out when you should publish your posts.
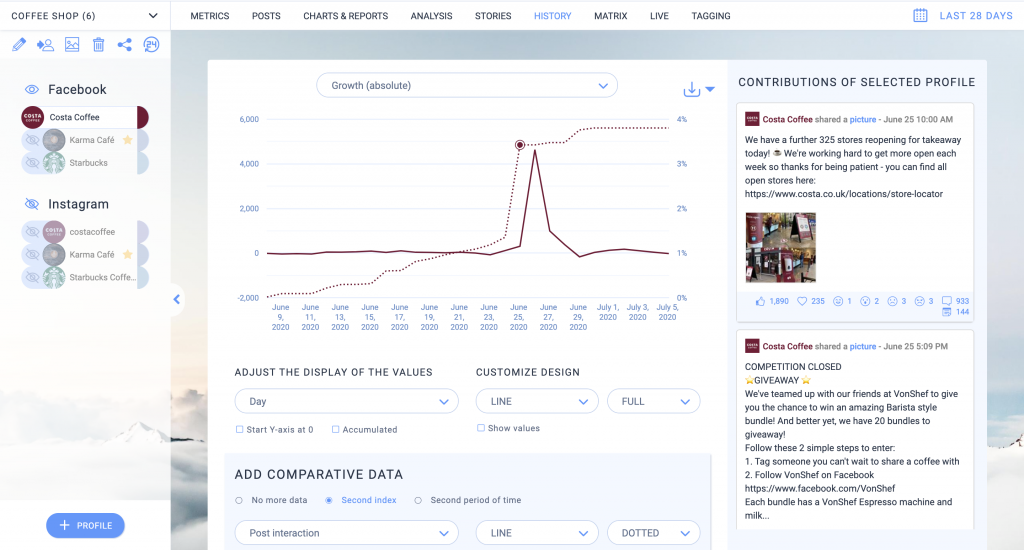
History
The history graph offers you the possibility to display very long periods of time or, for example, two different key figures together within a graph and to identify coherences.
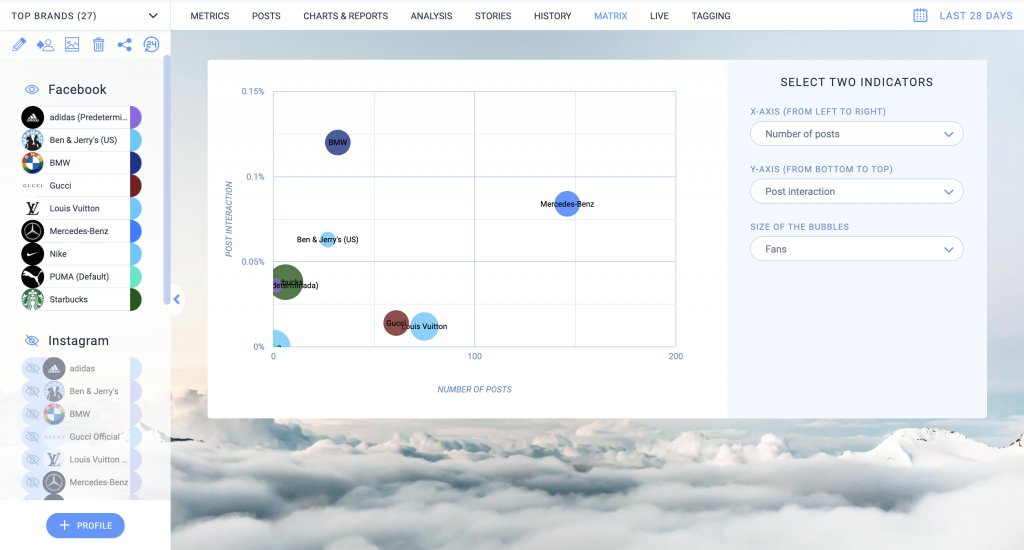
Matrix
The matrix uses two axes for two key figures and sorts the profiles of their respective values accordingly. This is very useful if one key figure is not sufficient to make a statement. For example, what use is a high number of followers if there is little interaction? You can see at first glance which profiles are successful in terms of both aspects. The further up and to the right the profile is located, the better.
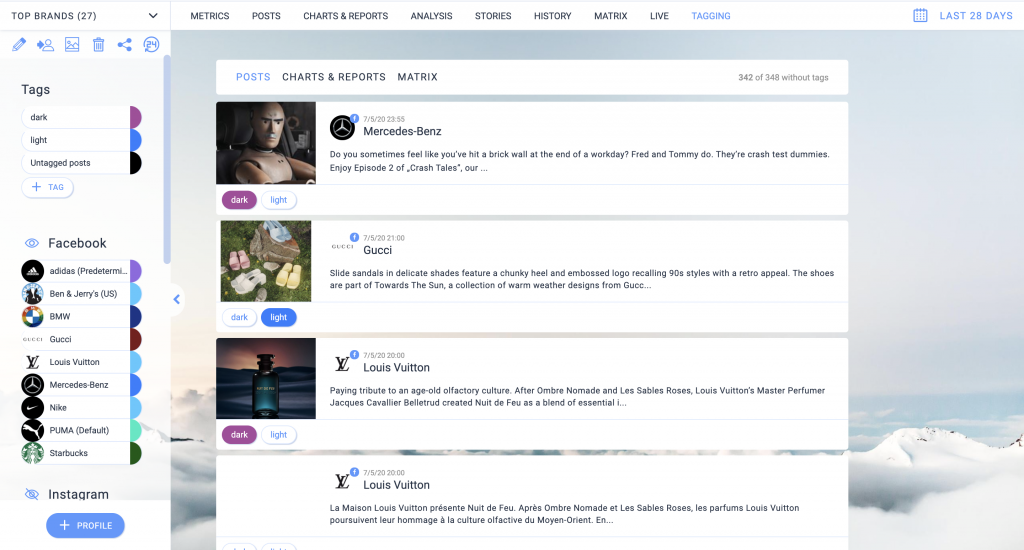
Tagging
Unlike most analyses, a tagging is used to examine posts for content characteristics. This works by creating tags for different qualities and assigning them to posts. Then you can evaluate the tags. For example, you can find out if holiday posts with landscapes are more popular than cities, or if dogs are more popular than cats… This way you can find out interesting and sometimes surprising things.
Sharing and Making Public of Social Media Dashboards
To share a dashboard with other members of your Fanpage Karma account, do the following:

- Click on the Share icon either in the dashboard overview or in the left bar of the dashboard
- Select all or specific team members
- Click on “Share”
To make a social media dashboard accessible to people who are not part of your Fanpage Karma account, you can publish it. External people can access the dashboard via a link and an access password, but they cannot change any settings. A public dashboard is especially useful if you want to give customers or colleagues the opportunity to stay in the loop on changing data that you have nicely arranged. You could say it is a live report for your customers.