Finding out the best time to post is important for you to reach your target audience exactly when they are receptive to your content. Fanpage Karma’s daytime analysis shows you when you can expect a lot of interaction for new posts. Here’s how it works.
Option 1
- Create a dashboard to which you add all relevant competitors in your industry (important: make sure that you add enough profiles that address the same target group as you do)
- Go to the Content report, where you will find the daytime analysis graph
- Select a period in the chart settings (the longer the period, the more posts are included in the analysis)
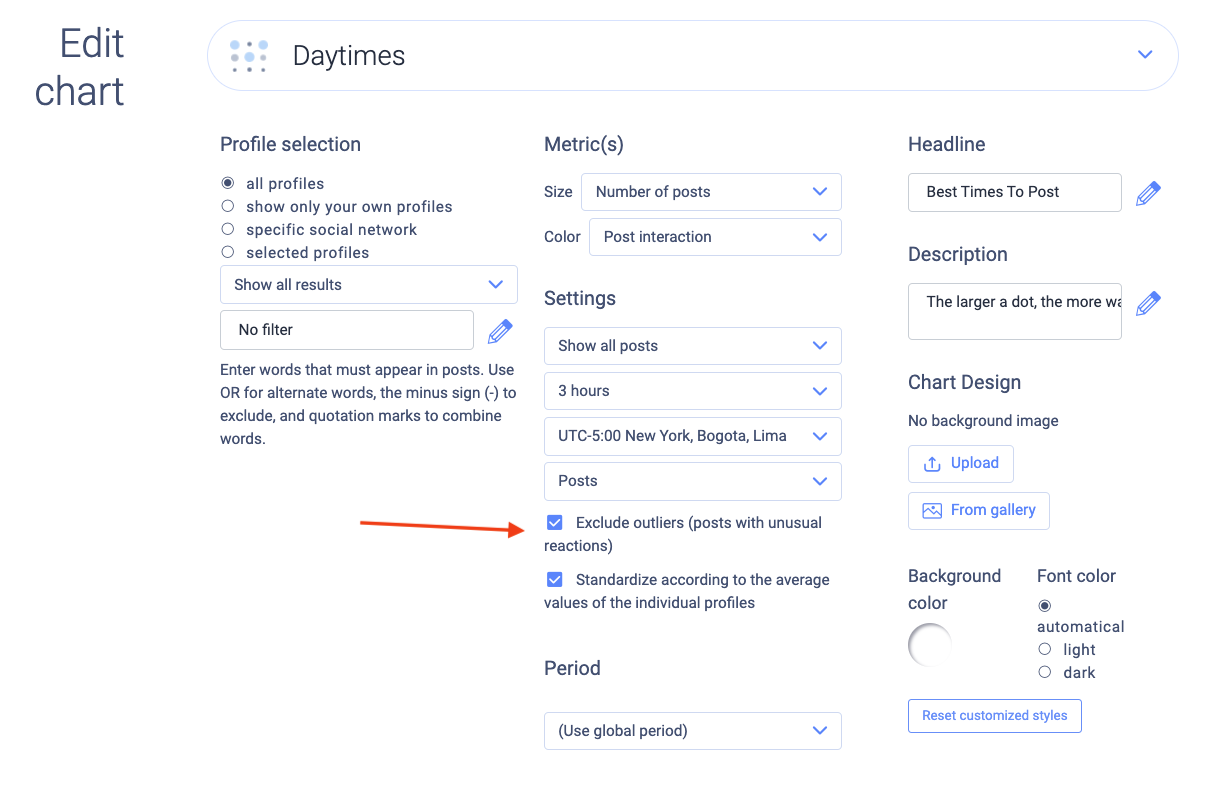
- Check the two boxes below to exclude outliers and imbalances between the profiles from the result
Option 2
- Add a new chart to the report of your choice
- Choose “Daytimes” as chart type
- Select a period in the chart settings (the longer the period, the more posts are included in the analysis)
- Check the two boxes to exclude outliers and imbalances between the profiles from the result
Tip: Perform the daytime analysis for each network individually. Since the individual networks have different characteristics and distribute posts differently, a mixture would falsify the result. Instagram posts, for example, are much more durable than tweets and therefore receive interactions longer. To exclude profiles or networks from the analysis, click Hide in the left bar.
Evaluate Result
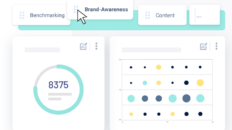
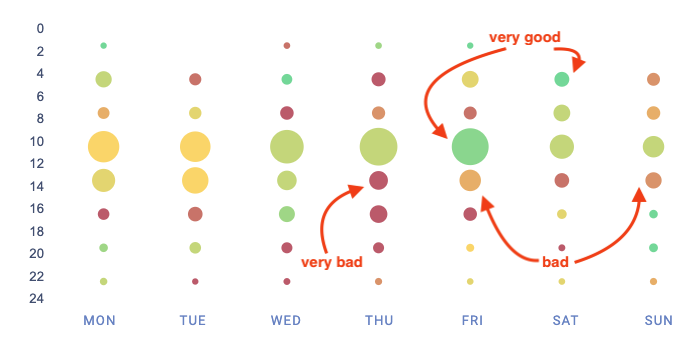
The graph shows you at which times of the week the most posts were made (size of the circles) and when there were the most interactions (color of the circles):
- the greener the circle, the more interaction occurred
- the bigger the circle, the more posts were made
→ The best time to post is where the circles are greenest. Here is where there were most interactions in the past. If the circles are green and large, this means that many posts are already being made at this good time anyway. So it makes sense to use the times of the small green circles for your posts, because here you have less competition.
Tip: Click on the circles to display the respective posts.
If you want to know even more precisely
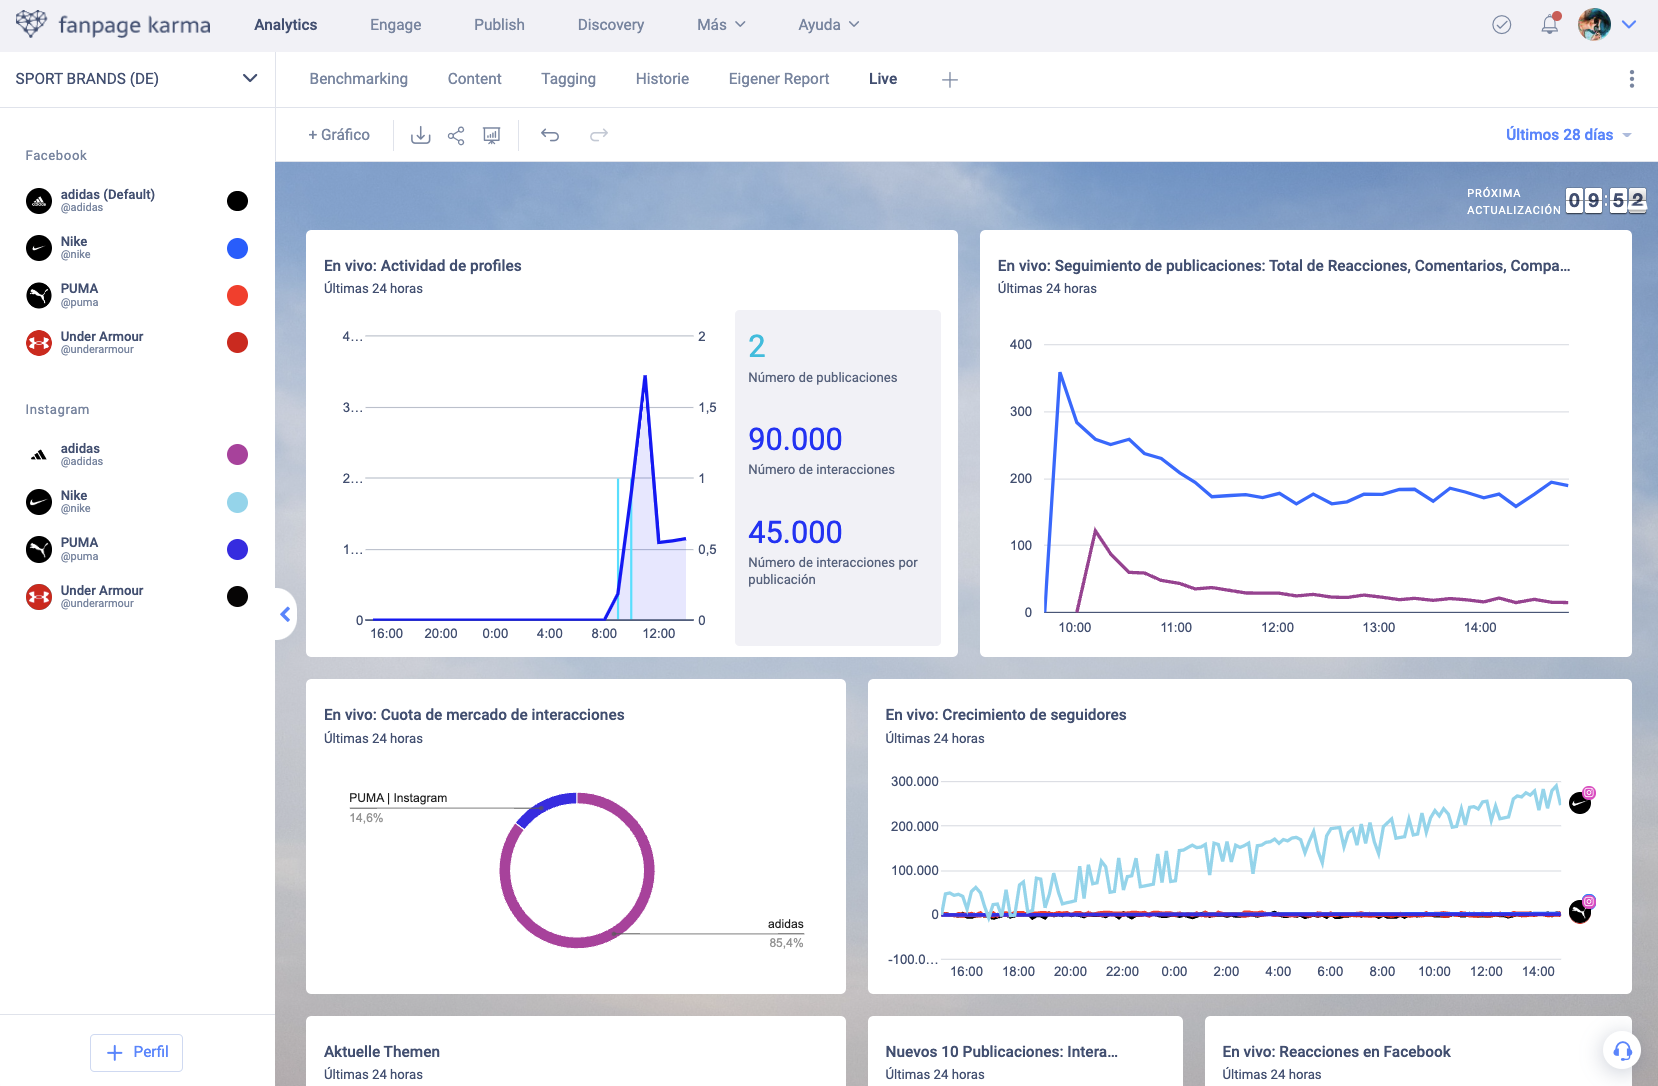
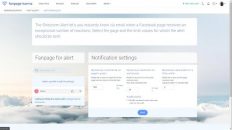
There is a way to make completely sure that now is the perfect time to post. The LIVE charts provide you with real-time data and give you an overview of the most important events in your industry. You’ ll learn how much is being posted, what the most discussed topics are and more.
Create a new chart and select the LIVE chart of your choice from our chart types. You can also use our live report, which is available among the report templates. Try it out right away!