The Analytics section of Fanpage Karma is the most used tool for many social media managers worldwide to analyze and present data around social media. That’s why we keep improving this section. Now we are making a big step that will bring many improvements for your daily work:
- Reports – the new flexible all-rounders.
- Improved standard reports
- Own report templates for the whole team
- Everything exportable to Excel, PowerPoint and CSV
- Display tagging in all reports
- Live – use data in all reports
- New chart types and options
- Undo when editing
- Online presentation
- Full screen mode
Tabs become Reports
A dashboard is the central place for analysis and exports of own profiles or the competition.

Until now, only the Charts & Reports tab could be edited individually. This changes now. All tabs in the dashboard can be added and designed according to your needs. Each tab is now a Report that you can design, export and share.
The Analytics section of Fanpage Karma is the most used tool for many social media managers worldwide to analyze and present data around social media. That’s why we keep improving this section. Now we are making a big step that will bring many improvements for your daily work:
- Reports – the new flexible all-rounders.
- Improved standard reports
- Own report templates for the whole team
- Everything exportable to Excel, PowerPoint and CSV
- Display tagging in all reports
- Live – use data in all reports
- New chart types and options
- Undo when editing
- Online presentation
- Full screen mode
Tabs become Reports
A dashboard is the central place for analysis and exports of own profiles or the competition.
Until now, only the Charts & Reports tab could be edited individually. This changes now. All tabs in the dashboard can be added and designed according to your needs. Each tab is now a Report that you can design, export and share.
Old tabs become more powerful
The old Metrics tab becomes Benchmarking and includes the metrics table, the matrix, and other charts that let you see at a glance which profiles are performing well or poorly.
The previous Posts tab is now called Content and the Post table has been expanded to include the charts from the previous Analysis section. So you can make a content analysis directly in this report.
You can add more pre-made reports (templates) to your dashboard. A template for hashtag analysis is ready, as well as for tagging or live monitoring. Add them to the dashboard and customize them according to your needs.
All your previously created charts in the Charts & Reports section will be automatically converted to reports of the new type and added to the Dashboard.
New reports can do more
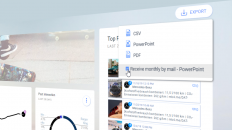
The new reports can be exported to Excel, PowerPoint and CSV. And also automatically emailed to your inbox on a weekly or monthly basis.
Tagging is a powerful tool when it comes to analyzing content. With tagging, you tag posts with keywords to find out which topics perform best with followers. This insightful analysis option is no longer limited to the previous Tagging tab. You can use individual charts with results from tagging in any report. Tagged post data is available for the entire dashboard in any report.
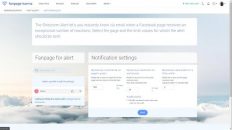
It’s the same with live data. You can set a dashboard to “Live” and then view and analyze data in real time. What was previously only possible in the special Live tab is now possible in every report. Just add one of the new “Live” charts and watch, for example, the development of the number of followers or, even more exciting, the likes on each post every minute.
TCharts are more flexible and powerful
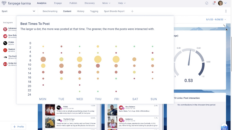
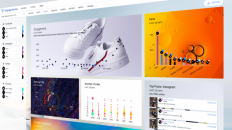
You can add as many charts as you want to each report. And the selection is also getting bigger. In addition to the live charts just mentioned, a post table, a speedometer and an interactive, three-dimensional content or hashtag cloud are available, as well as the option to include an image or a video. Another new feature is the goals chart. Here you can define a target for a metric and show the percentage of profiles that meet that target.

And the settings for individual charts have also been greatly expanded. You can create analyses based on types of posts, for example, reels or links. Or you can look at which hashtags get the most post interaction. And as mentioned, of course, all analytics based on tags (keywords).
Also, you can set a custom comparison period per chart, so in some charts in your report you can compare the current data with the previous period and see changes at a glance.
You can add a description to each chart to explain in more detail what you see on the graph.
Use your favorite reports as templates in any dashboard
Once you’re happy with a report, you can save it as a template and use it in every dashboard in the future. Your teammates can also use these templates in their dashboards. This will save you time and allow you to set up standardized reporting across all channels.
Undo and history make editing easier
Changing reports and charts is made much more convenient with an undo function. You can now easily change a few metrics and play around and then revert back to the previous state by undoing.
An additional history of backups allows you to quickly jump back to the state of the report in case someone messed everything up.
Share and present your reports online
Of course, you can download and share all reports as Excel, PowerPoint, PDF or CSV. It’s even easier to present the results directly online. Either on-site in full screen mode: This shows the charts of the report over the whole screen like a PowerPoint presentation, but with the advantage that the charts remain interactive.

Or you can use the online presentation and share the current status of the report with customers or colleagues. You send a link to them and they can view the frozen status of the report themselves at any time – password protected, of course.
So much more to discover
We have optimized many more small things, and so much will be added that it would go beyond the scope of this blog article. If you require any further assistance, feel free to contact us at service@fanpagekarma.com.