
The time has come: finally, you can evaluate TikTok with Fanpage Karma! In this article, you’ll learn which TikTok analytics we prepared for you, how to use them to measure the performance of your profiles and how to find out which tricks your competitors use to attract your target audience. Here we go!
What you can evaluate
You can use Fanpage Karma to examine the performance of TikTok profiles as a whole, as well as to dive deep into evaluating individual posts. The TikTok analyses can be applied to any number of profiles, whether you manage them yourself or not. All metrics values displayed are based on public data.
To measure the performance of profiles and videos, you have a variety of metrics at your disposal, which you can tabulate and export as you wish. A complete list of TikTok metrics can be found at the end of this post.
Measuring TikTok Channel Performance
The overall success of a TikTok channel can be measured by basic metrics such as followers, profile likes, number of videos posted, and engagement rate. Therefore, you can learn everything about how much a channel is growing, how big its video output is, and how much users interact with their posts in general.

It also shows you the channel’s strongest and weakest videos and tells you which music, challenges, and mentions led to most interactions.
Observe, compare, and benchmark your competition
To know which goals are realistic and desirable for your business on TikTok, you can easily determine the benchmarks of your industry. To do this, add all of your competitors to a dashboard, tabulate them, and take the average of the metrics as a guideline. If your company is above average, that’s great. If not, you’ve uncovered a weakness and can work to improve that metric.
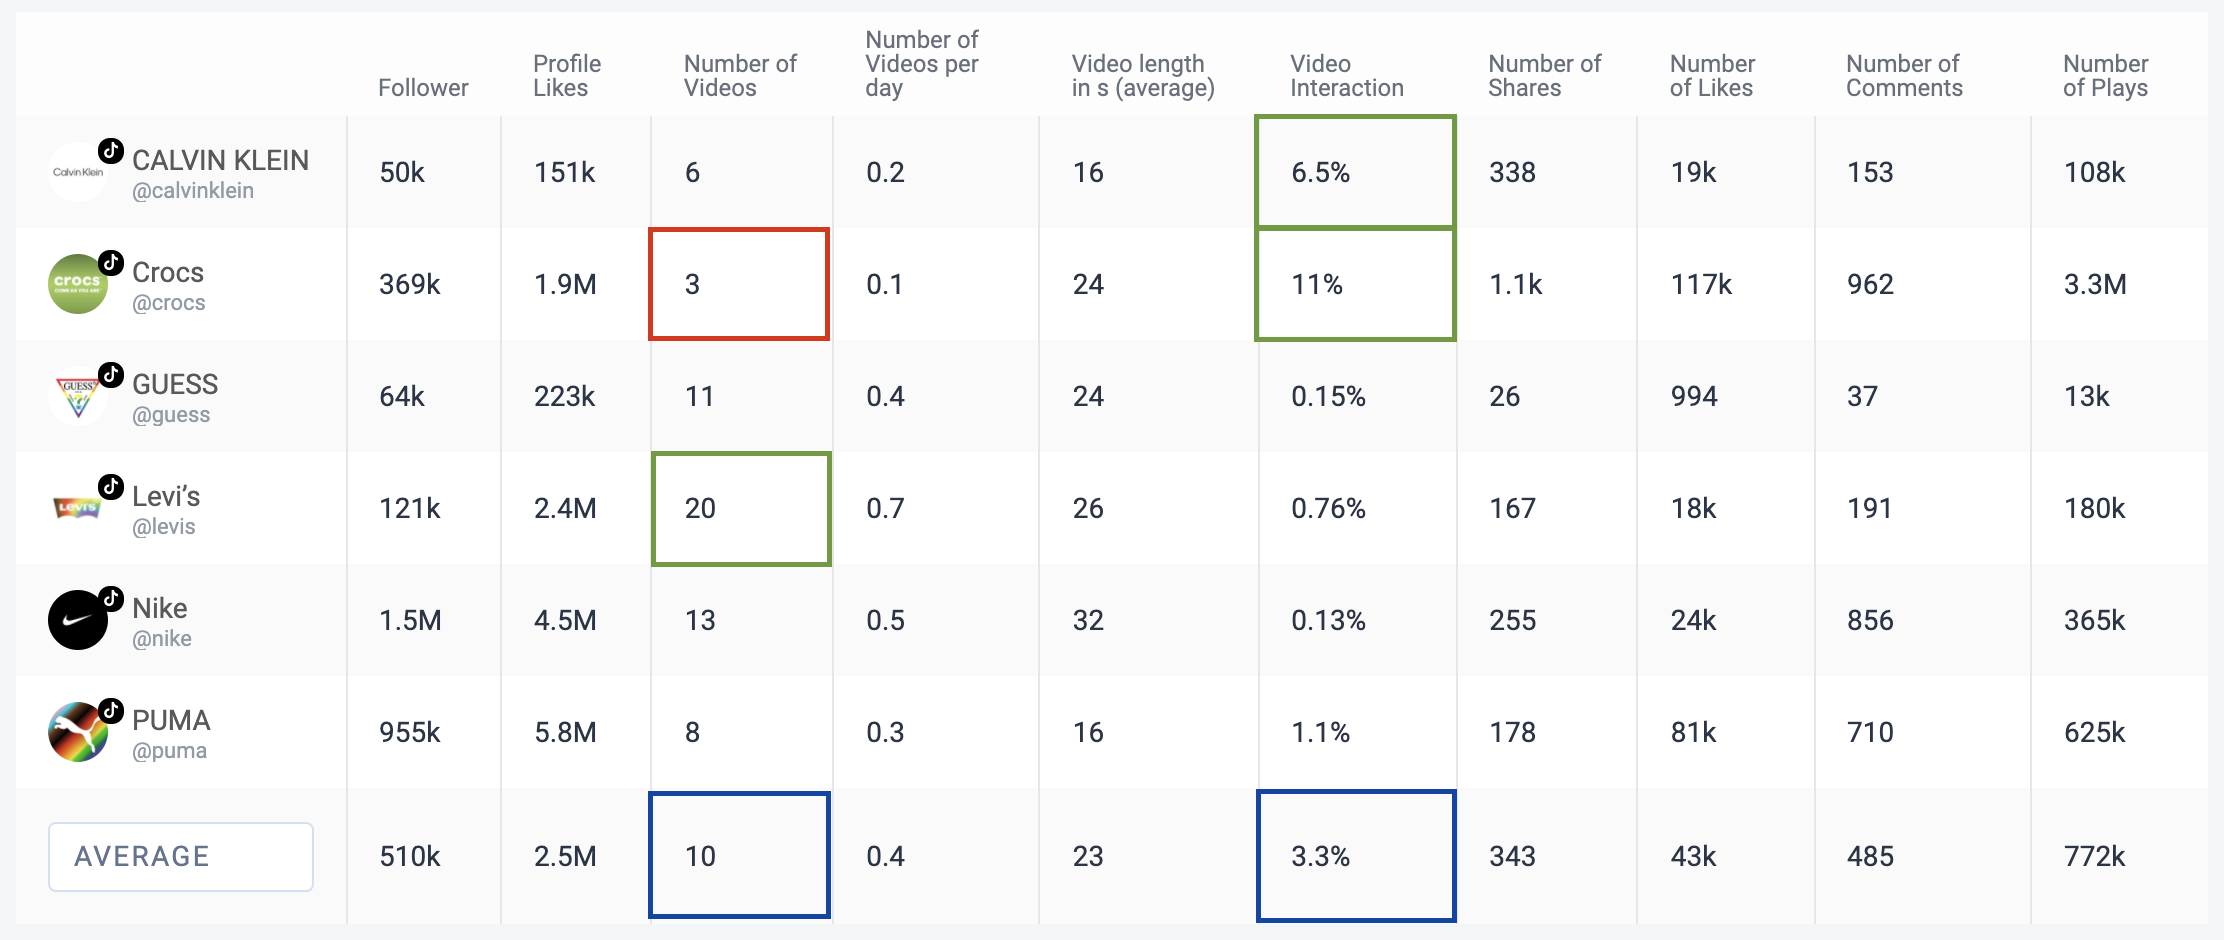
The example shows great representatives of the fashion industry. The profiles post an average of ten TikTok videos a day. That is the benchmark. With three videos, Crocs is well below the value. Levis, on the other hand, clearly outperforms the benchmark with twenty videos.
It’s also noticeable that both Crocs, at 11%, and Calvin Klein, at 6.5%, have exceptionally high video interaction, well above the average of 3.3%. As a competitor, it’s worth asking which videos have generated so much buzz.
Identify most successful videos
A complete list of TikTok videos from the selected profiles, sorted by likes, shares or the number of plays, for example, will show you which videos resonate best with the users.

You also get an overview of the top hashtags, words, music, challenges as well as mentions used by the profiles.
Export and present data
Once you’ve collected all the TikTok data you want, you can easily export your analysis as PowerPoint, PDF, Excel or CSV, or share your dashboard with colleagues or external people.
Now it’s your turn!
Do you feel like optimizing your TikTok channels? Then don’t waste any more time. You can try Fanpage Karma for free right away!

List of TikTok metrics
- % of total posts
- Follower
- Following
- Profile Performance Index
- Followers-Following-Ratio
- Follower Growth (absolute)
- Follower Wachstum pro Tag (absolut)
- Follower Growth (weekly, in %)
- Follower Growth (in %)
- Follower Growth since starting point (in %)
- Engagement
- Profile Likes
- Profile Videos count (overall)
- Number of Videos
- Number of Ad Videos
- Number of Videos with duet enabled
- Number of Videos which are Duets
- Number of Videos per day
- Number of Videos with share enabled
- Number of Videos with stitch enabled
- Number of Videos which are Stitches
- Video length in s (average)
- Video length in s (sum)
- Video Interaction
- Number of Likes
- Number of Plays
- Number of Shares
- Number of Comments
- Number of Shares, Likes, Comments
- Plays per Day
- Plays per Follower
- Reactions per Play